MILLENNIUMS.AI documentation
MILLENNIUMS.AI is an AI-Native Application Protection Platform (ANAPP), powered by Redthread. It is agentless-first — it installs nothing to deliver its core value — and every capability is a module you switch on per workspace from one console.
Redthread starts by building the map — because until you know how your agents, code, cloud and infrastructure connect, a list of findings is just a list. It assembles one graph of your whole estate — agents, applications, code, cloud accounts, identities, the security controls you already run, and the data they can reach — and every module reads and writes that same graph, so the risk you see first is the one that spans layers, not an isolated finding on a list.
On top of that map, the platform runs as modules you enable per workspace:
- Assess & Consolidate — the agentless front door: connect agentless and get a posture score, the AI surfaces nothing is watching, and a replace-map of the incumbent tools a Redthread module can retire, with input-driven consolidation ROI.
- AI application pentesting — autonomous agents probe your chatbots, agents and RAG endpoints against the OWASP LLM Top 10 (mapped to MITRE ATLAS); every finding carries a reproducible proof of concept.
- Shadow-AI discovery — inventory every AI-powered feature across your estate, including the ones nobody registered.
- Cloud & infrastructure posture — connect a cloud agentless (nothing installed) to map assets, identities and data, classify sensitive stores (DSPM), and surface cross-cloud attack paths.
- Endpoint telemetry (detect-only) — an optional, in-core thin agent on OS-safe surfaces reports on-host inventory and posture. It never blocks; real-time prevention is a partnered add-on on the roadmap.
- Agent Trust Fabric — give every agent/identity a SPIFFE id and broadcast signed, TTL'd trust-state events (safe/unsafe/revoked) off proven exploits, so orchestrators, gateways and SIEMs react in seconds. See Agent Trust Fabric.
- CI/CD gating — scan on every pull request and block a merge that would introduce a proven attack path.
- Continuous platform — scheduled re-assessment with drift and trend, so coverage reflects what is in production this week.
- Remediation & reports — plain fixes and draft pull requests; a Letter of Attestation, the full technical report, and a machine-readable twin, mapped to the frameworks your auditors ask about.
- Identity & access — SSO, SCIM provisioning, roles and audit logs for your workspace.
Proven, not inferred. A finding is something the engine actually reached or exploited, with the exact steps to reproduce it; coverage is only claimed where the graph carries it. The platform is agentless and detection-first — any prevention/blocking action is a signed, opt-in, customer-owned exception, never a default, and every update we push to a sensor is staged behind the always-on AI Rollout Safety gate so it can never take a fleet down.
This documentation covers getting started, the platform architecture, the core concepts behind how the platform works, task-based guides, and the full API reference so you can drive every module from CI or your own scripts.
Quickstart — in the browser
The fastest way to see a result. No install, no card.
- Create your account. Go to scan.millenniums.ai/app and sign up with your email. A work email is best; a personal one works too. No card.
- Connect your estate. You land on Estate Scan. Connect as much or as little as you like — a website URL needs no credentials, GitHub is one click, and a read-only cloud role (or a pasted read-only inventory JSON) is the single biggest jump in coverage. Discovery across all of it is free and unlimited; the meter shows what's still dark and nothing blocks the scan.
- Verify your email. Click the link we send you. This unlocks active scanning. (Didn't arrive? Use "Resend" in the app.)
- Point a pentest at one target. For the active, exploit-proving scan, paste your app's staging URL — the live address where it's running (not production). Optionally drag in your code (a
.zip) for a deeper scan. Press Start a scan. - Watch it work. The scan runs in an isolated sandbox and typically finishes in minutes. You'll see it probe each category live.
- Read the findings. Each proven vulnerability comes with its severity, impact, and a plain remediation. On a paid plan, every finding also includes a working proof of concept and a draft fix.
Prefer an app? Redthread is also available for Mac and Windows from the download page. It is the same product in its own window; your data stays on the server, so the app and the browser always show the same workspace. To sign in, enter your email in the app and open the emailed link — your browser asks to open Redthread and hands the sign-in to the app (the millenniums:// link is single-use and expires in 15 minutes). The installers are not yet signed with an Apple or Microsoft certificate, so a downloaded copy is blocked until you confirm it once. On a Mac, the one-line Terminal install on the download page avoids the prompt entirely; with the .dmg you confirm once via System Settings → Privacy & Security → Open Anyway. On Windows, click More info → Run anyway.
Quickstart — with the API
Prefer to drive it from a terminal or CI? Everything the app does is a REST call. Your access token is created at signup and shown in the app; it goes in an Authorization: Bearer header.
1. Check your account
Confirm your token works and see your plan and remaining quota.
curl https://scan.millenniums.ai/api/me \
  -H "Authorization: Bearer YOUR_ACCESS_TOKEN"
{ "tenant": "acme-3f9a2c", "plan": "starter", "plan_display": "Starter", "poc": true,
"scans_used": 1, "scans_limit": 5, "apps_used": 1, "apps_limit": 1, "verified": true }2. Start a scan
Give it a target. Optionally add source (a repo or path) for a much deeper white-box scan, and a budget spend cap.
curl -X POST https://scan.millenniums.ai/api/scan \
  -H "Authorization: Bearer YOUR_ACCESS_TOKEN" \
  -H "Content-Type: application/json" \
  -d '{"target":"https://staging.yourapp.com/chat","budget":10}'
{ "run_id": "20260731-abc123" }3. Read the results
Poll the run until running is false, then read its findings.
curl https://scan.millenniums.ai/api/runs/20260731-abc123 \
  -H "Authorization: Bearer YOUR_ACCESS_TOKEN"
That's the whole loop: me → scan → runs/<id>. The API reference documents every field.
How it works
MILLENNIUMS.AI is agentless: you connect a target or a cloud, switch on the modules you want per workspace, and everything runs from our cloud. Under every module sits one idea — the graph.
- Map. Redthread builds one graph of your estate — agents, applications, code, cloud accounts, identities, and the data they can reach — from whatever you connect: an agentless cloud role, a repository, a running app.
- Assess. The modules you enabled run over that map. Autonomous agents pentest your AI apps in an isolated sandbox; shadow-AI discovery inventories every model surface; cloud & infrastructure posture and DSPM classify assets and sensitive data; dependency-CVE analysis checks what you inherit.
- Prove. A finding is something the engine actually reached or exploited — with the exact steps to reproduce it. Only real results become findings; unproven leads are held separately. Nothing is inferred.
- Rank. Findings go back onto the graph, so the risk that spans layers — an internet-facing app whose credential reaches classified data in another cloud — surfaces above a list of isolated issues.
- Act. Each finding carries a plain remediation and, when you want it, a draft pull request. The CI gate blocks a merge that would introduce a proven attack path, and remediation can fire a signed webhook or open a Jira / ServiceNow ticket.
Nothing is installed on your systems for the core product; modules are switched on per workspace from the cloud (see the architecture diagram). Optional agents go deeper when you want them: a thin outbound-only connector for scanning inside your network, a Kubernetes eBPF runtime sensor, and a per-host endpoint agent — all detect-only, never blocking. AI-app scans run in an isolated per-scan Docker sandbox that is destroyed when the scan ends.
Tools: autonomous AI agents driven by frontier LLMs, guided by our vulnerability skill pack (OWASP LLM Top 10 2025 + MITRE ATLAS); CVSS 3.1 scoring; dependency CVEs via osv-scanner; the estate graph exports as plain node-link JSON. The flagship module is the AI-application pentest — the rest of this section documents every module and the API behind it.
Platform architecture
One picture of the whole platform: how what you connect becomes one graph, how the modules you switch on read and write that graph, and what comes out the other side — reports, ranked attack paths, quantified consolidation, and signed trust signals. Everything is agentless-first; the two on-host agents are opt-in and the endpoint agent is detect-only.
Read it left to right: you connect sources (agentless by default; the connector and the detect-only endpoint agent are opt-in, and SPIRE issues workload identities); everything lands on one graph whose closed vocabulary of node kinds and edges powers the T1–T8 toxic-combination rules and carries each actor's trust state; the modules you switch on read and write that graph; and the platform emits outputs and actions — a current-state report and replace-map, quantified ROI, ranked attack paths, signed trust events to your own systems, fix PRs, and — opt-in, in preview — ATF Enforce decisions: an inline allow, deny or pause on a live agent request before it leaves, with a signed receipt a third party can check, available only to an identity that has passed its burn-in review. The entitlement plane governs every switch; the AI Rollout Safety gate governs every update we push to a sensor.
Assess & Consolidate
The agentless front door. Connect a cloud account or run a scan and Assess turns the graph into a current-state report: where you're covered, the AI surfaces nothing is watching, and which of the tools you already pay for a Redthread module can replace. Nothing is installed. Open the Assess & Consolidate tab in the console.
- Posture — every asset is scored covered, partial (a control watches it, but it has an open high/critical finding), or uncovered, rolled up per domain: AI & agents, identity, data, cloud infra, endpoints, code. A domain score is
100 × (covered + ½·partial) / total. - AI gaps — the AI models and deployed agents that no control covers, called out first. A deployed agent is a first-class node on the graph (an AI that can act), so its blast radius is part of the map, not a footnote.
- Consolidation replace-map — for each security tool you run, the Redthread module(s) that could replace it. We only offer a live module as a replacement; a capability still on the roadmap (e.g. an endpoint EDR sensor) is named as roadmap, and a tool we complement rather than replace (a SIEM — we feed it) is labelled complementary. Honest by construction.
- Module marketplace — every capability is one switch, with the reason an off module is off (plan tier, a scan type not enabled, an add-on not granted, or a dependency). Entitlement is read live, so a downgrade revokes immediately.
How coverage is known: your security stack becomes control nodes on the same graph, drawn from two honest sources — the tools you declare in the stack editor (owner-only), and tools we can prove are running because we already ingest their findings (GuardDuty, Security Hub, Inspector, Macie, Prowler, Defender, Security Command Center). A control covers the asset kinds in its category scope (an EDR covers compute/endpoints, a DSPM covers data, a CSPM covers cloud infra); a SIEM or a pentest service gets a node but no coverage edge — it observes or tests, it doesn't continuously protect. Coverage is never inferred: the absence of a covers edge is the finding. See the Assess API.
Quantification — money and effort, never fabricated
Assess turns the current state into numbers, but only from inputs you supply — nothing is invented:
- Consolidation ROI — the annual spend you'd address by replacing tools a live Redthread module covers. It sums only the declared tools you priced; a replaceable tool with no cost entered is counted and named, never guessed. A roadmap-only or complementary tool is excluded from the figure.
- Risk exposure — reported as counts (uncovered assets, AI gaps) by default; it becomes a dollar figure only if you enter a per-incident breach cost, and the basis is shown alongside it.
- Remediation effort — the number of items to fix is always real; hours and cost appear only when you provide hours-per-fix (and a blended rate).
Set these optional assumptions (breach cost, hours per fix, blended rate) in the stack editor. Leave them blank and Assess stays honest with counts.
Endpoint — detect-only, in the core
On-host visibility is part of the core platform, not a paid add-on. A thin agent runs on OS-sanctioned safe surfaces — Linux eBPF, macOS Endpoint Security System Extension, Windows ETW — and reports what it sees. It is detect-only: it never blocks, kills, or quarantines. The worst it can do is crash its own process; it cannot take a machine (or a fleet) down. Each reporting host becomes an endpoint asset covered by our own detection, so its posture rolls into Assess; deployed AI agents seen on a host become agent nodes — and note we do not mark those covered, because an EDR watches the host, not the agent's logic, so an unwatched agent still surfaces as an AI gap. The owner enrolls the agent from the Assess console (mints a key); the agent posts telemetry to the ingest API.
The agent is a single static binary (macOS, Linux, Windows — no runtime to install, no kernel driver) that runs in userspace and needs only outbound HTTPS. Run mai-endpoint -print to see exactly what a host would send before enrolling it: a hashed machine id (never the raw hardware UUID), hostname, OS, disk-encryption and firewall state, and the AI frameworks running on the host — never file contents, environment variables, or command lines. Run continuously (MAI_KEY=… mai-endpoint) or once (-once) from a service/cron.
Real-time prevention (isolate a host, kill a process, quarantine a file) is the one opt-in — a partnered engine, surfaced in the marketplace as Endpoint Prevention (partner). We do not hand-write a kernel driver: enforcement stays the partner's, behind our AI rollout-safety gate. The platform-side integration is built and live — inbound posture (POST /api/endpoint/prevention, distinguishing blocking from merely watching), a signed outbound enforcement request the partner may refuse, and per-tenant activation the moment a partner is connected (POST /api/endpoint/prevention/connect, Enterprise + the add-on). Ask us to connect a partner for your workspace.
AI Rollout Safety — always on
Every content/config update we push to any sensor is validated before it ships (a malformed payload is rejected — the direct lesson of the July-2024 industry outage), then staged through canary rings (1% → 10% → 50% → 100%) with automatic anomaly-halt: if a ring's crash or error rate crosses the threshold versus a pre-push baseline, the rollout stops before it reaches the next ring. No update ever reaches the whole fleet at once. This is a platform guarantee, on for every workspace.
Agent Trust Fabric
Agentic identity + continuous trust signals, on SPIFFE.
An opt-in module that gives every discovered agent and identity a durable, verifiable identity and broadcasts its trust state — safe / unsafe / degraded / revoked — in real time, so orchestrators, agent gateways, and SIEMs can react in seconds instead of waiting for someone to read a report. It rides the graph and the exploit-validation pipeline you already have; it is off by default and strictly additive — a workspace that never activates it sees no change.
It sits at the intersection of two industry categories: non-human / workload identity (the same problem SPIFFE/SPIRE solves for service accounts and machines, extended to AI agents) and continuous access evaluation (the CAEP/RISC Shared-Signals pattern used for real-time revocation in enterprise identity). Agent Trust Fabric is our name for both halves as one mesh — every agent gets a verifiable identity, and its trust state streams live to whatever needs it.
- Identity — SPIFFE/SPIRE. Every agent/identity/AI node gets a
spiffe_id. Deploy the CNCF SPIRE engine per-tenant with one Terraform step from the console (it targets the same cluster discovery already reads; the signing keys never leave your cloud) and it issues short-lived, auto-rotated SVIDs that flow back onto the graph. Until you deploy it, Redthread assigns a deterministic SPIFFE id so the layer works today. Vendor- and model-blind: identity is issued to the workload, never to the model inside it. - Trust badges on the graph. Once active, every node in the Redthread Flow view carries a trust badge (green safe / red unsafe / amber degraded / gray revoked), sourced from the same
trust_statefield. - Trust state, proven not guessed. A node flips to unsafe only on a proven exploit (never an inferred one); degraded covers a potential-but-unconfirmed finding or an expired SVID; revoked is a manual operator override.
- Signed, TTL'd events. Every trust-state change is emitted as an Ed25519-signed, expiring event shaped after the CAEP/RISC standards, with a link back to the finding that caused it. Any third party can verify an event offline against your workspace's public key — no live call back to Redthread.
- Delivery. Register one or more webhooks (with an optional HMAC shared secret); a signed event fans out on every change. An append-only ledger lets a subscriber that missed events catch up.
- Enforce — preview. An opt-in inline gateway that decides allow / deny / deny-and-pause on a live request against a structured grant (host, method, path, body size) before it reaches its destination, instead of only recording it afterward. Every new grant starts in shadow — decide and record, forward everything, exactly like today — and the API itself refuses to switch an identity to enforcing until a burn-in gate is satisfied: real traffic watched under that exact grant for long enough, and every request it would have blocked reviewed and agreed by the operator. There is no override. See the API for the full route surface.
The default is still identity + trust-state only — not a permissions/VC system, and not (in v1) cross-organization federation. Enforce, where an identity has earned it, adds a real decision point in the request path; it is never claimed as a guarantee against a novel attack that matches no rule.
How we compare
Where MILLENNIUMS.AI sits, architecturally, next to platforms teams already know. On the agent axis we are agentless-first, like Wiz; what is different is that we prove risk by exploiting it, and the Redthread graph treats AI agents and applications as first-class nodes, not just cloud infrastructure. This is an architecture comparison — Wiz, Palo Alto and CrowdStrike are large, multi-product suites, so the point here is shape, not feature parity.
| MILLENNIUMS.AI | Wiz | Palo Alto (Prisma + Cortex) | CrowdStrike Falcon | |
|---|---|---|---|---|
| Core model | Agentless-first assessment | Agentless-first CNAPP | Hybrid agentless + agent suite | One agent on every endpoint |
| How it collects | Agentless cloud role; point at a URL/repo — installs nothing | Cloud API + snapshot scanning | Cloud APIs + Defender/Cortex agents | Kernel/eBPF sensor streaming telemetry |
| Correlation graph | Redthread — apps, agents, code, cloud, identities, data → ranked paths (T1–T8) | Security Graph — toxic combinations | Prisma graph + Cortex XDR/XSIAM analytics | Threat Graph — endpoint events |
| Findings basis | Proven — autonomously exploited, reproducible PoC | Inferred from cloud state (reachability) | Config + agent telemetry | Runtime behavioral detection |
| Runtime | Optional eBPF sensor — detect-only, never blocks | Optional Wiz Sensor (eBPF) | Agents prevent + respond | The whole product — runtime EDR |
| Primary purpose | AI-app pentest + agentless CNAPP, graph-first | Agentless CNAPP posture | Full-lifecycle prevent/detect/respond | Runtime endpoint protection |
Closest to Wiz. Agentless by default, with a security graph at the core that turns raw findings into ranked attack paths and toxic combinations. The difference: Wiz infers risk from cloud state; we prove it — an autonomous pentest runs the exploit and attaches a reproducible PoC — and our graph makes LLM apps and agents first-class nodes (OWASP LLM Top 10, MITRE ATLAS), not just cloud resources. So we are, in shape, "an agentless CNAPP graph with an offensive AI-application pentester on top."
Unlike Palo Alto. Prisma Cloud + Cortex is platformization — many products and agents (agentless + Defender + an AI SOC across endpoint, network, cloud and identity). We are one agentless platform with modules switched on per workspace. Palo Alto prevents and responds at runtime; we stay a testing and assessment tool by design — our optional runtime sensor only detects.
Unlike CrowdStrike. Falcon's premise is one agent on every endpoint doing runtime EDR. We install nothing for the core product and do not do runtime prevention. We overlap only in "cloud-activated modules" and in running a correlation graph — but Falcon graphs endpoint events, Redthread graphs your estate and its proven attack paths.
What to point it at
The single most common question, answered up front: you give us a target, and optionally your source. They're not the same thing.
| Target (required) | Source (optional) | |
|---|---|---|
| What | Your live, running app — a URL or API endpoint that answers requests right now. | Your code — a git repo or an uploaded .zip. |
| Why | It's what the scanner actually attacks. | Lets the scanner read the code as it attacks (white-box) — deeper findings. |
| Example | https://staging.yourapp.com/chat | github.com/acme/app or my-app.zip |
Staging vs production — always aim at staging
- Production is the real app your customers use, with real data.
- Staging is a separate, running copy in a test environment — the same app, but with no real customers or data.
The scanner is a real attacker: it submits inputs, can create records, trigger actions your app exposes, and drive up model cost against your app. On staging that's harmless. On production it can mean junk data or real side effects for real users. Only scan production if you understand and accept that (a test account and a quiet time help).
How do I know my URL? A staging URL looks like…
It's just a web address where your app runs. Common shapes:
staging.yourapp.comorapp-staging.yourapp.com- A preview URL from Vercel or Netlify (they mint one per change)
- A
*-staging.onrender.comor*.herokuapp.comapp - A local address (
localhost:3000) exposed to the internet with a tunnel (ngrok, cloudflared)
Easiest: let the app find it for you
In the app, paste the one link you already know — your main website or app address — into "Not sure what to scan?" and press Find what to scan. We look at the page, spot the AI features and API endpoints, and check public records for your other environments (like staging. and app.). You get back a short list of recommended targets — click one to scan it. No hosting logins, no hunting.
Find it yourself — no developer needed
Prefer to do it by hand, or want to double-check? You don't need anyone technical. Two reliable ways:
- Open your own app and copy the link. Use your product the way a customer does — go to the page with the AI feature (the chat, the assistant) and copy the address straight from your browser's address bar. That address is your target.
- Follow the money to your hosting account. Your app runs somewhere, and whoever's card pays the hosting bill can see every URL. Check your statements for Vercel, Netlify, Render, Heroku, AWS, DigitalOcean, Google Cloud, log into that account, and the dashboard lists your app's addresses — production and any staging/preview ones.
Backup routes: your domain registrar / DNS (GoDaddy, Namecheap, Cloudflare — wherever you bought the domain) shows subdomains like staging., app., api.; or ask your hosting provider's support from inside your account.
I don't have a staging URL — how do I get one?
- Most hosts spin up a staging copy in one click from your account — Vercel, Netlify, and Render all offer free preview/staging environments, no code required.
- If your app is on GitHub, a preview URL is often generated automatically on each pull request.
- Only have production? You can still scan it — just treat it as a live attack (quiet time, a test account, expect some junk data). See Staging vs production above.
- No one technical at all? A freelancer can stand up staging in an afternoon — then you paste that URL here.
Once you have the URL, follow Run your first scan. Add your code (upload or repo) for a deeper white-box scan.
Black-box vs white-box
How much you give the scanner decides how much it finds.
- Black-box — you give only a live URL or API. The scanner attacks from the outside, like an anonymous attacker. Fast, zero setup, but it can only find what's reachable from the front door.
- White-box — you also give the application's source. The scanner reads the code as it attacks, so it understands the tools, prompts, and data paths behind the endpoint. This is a large uplift in both the number and the depth of findings.
Two ways to hand over the source — you don't need to know git:
- Upload a
.zipof your project. In the app, drop it into the scan box; over the API, upload it and pass the returnedupload_id. Your code is held only for that scan and deleted when it ends — never used to train. - Point at a git repo — GitHub, GitLab, Bitbucket, or Azure DevOps. Paste the repo URL in the
sourcefield, or in the app Connect GitHub once and pick a repo (including private ones) from a dropdown. For other hosts, paste the URL; private repos there use the.zipupload.
Complete scan — both passes, one click
Turn on Complete scan (the checkbox on the scan form) to run both passes for one target automatically: a black-box pass probes the live endpoints, then a white-box pass reads your source and re-tests the known surface. You get one merged findings list, each card tagged by the pass that found it. It needs your source (a repo or .zip) and uses about twice the budget of a single scan.
The white-box pass carries the black-box findings forward and re-tests each one: an issue that's still exploitable is shown as a ↻ re-confirmed regression (counted once, not twice), and anything only the source could reveal is added as new. Even the Free plan can run a Complete scan — capped at $20 total ($10 per pass).
What it tests
Every category on the OWASP LLM Top 10, mapped to MITRE ATLAS:
- Prompt injection
- Sensitive information disclosure
- Supply chain
- Data & model poisoning
- Improper output handling
- Excessive agency (tool & agent abuse)
- System prompt leakage
- Vector & embedding weaknesses (RAG)
- Misinformation
- Unbounded consumption (runaway cost)
The full matrix, with the mapping to MITRE ATLAS, is published on the Trust Center.
Tools: our per-category vulnerability skill pack, keyed to OWASP LLM Top 10 2025 and MITRE ATLAS v5.6.0 (technique ids verified against the source, not recalled). Supply chain has its own section.
Findings & proofs of concept
A finding is a vulnerability the scanner proved, not a guess. Each one carries:
| Field | What it is |
|---|---|
title | One-line summary of the vulnerability. |
severity | critical high medium low — impact-ranked. |
cwe / cvss | Standard weakness ID and CVSS score, when applicable. |
impact | What an attacker gains in plain terms. |
technical_analysis | Why it works, for an engineer. |
remediation | The concrete fix. |
poc | A working, re-runnable proof of concept. Paid plans only. |
endpoint / method / locations | Where it lives — the request and the code locations. |
poc) is held back. Upgrading to any paid plan unlocks it on all findings, including past ones.Dependency CVEs — how the list gets short
A dependency scan on a real app returns hundreds or thousands of known CVEs. Handing you that list is worse than useless: everything looks urgent, so nothing is. Each one is filtered through four questions, and only what survives is put in front of you.
| Stage | The question | What it removes |
|---|---|---|
| 1. Inventory | What versions do we actually depend on? | Everything you don't ship. The full list is kept as your dependency inventory (SBOM) — nothing is hidden, it's just not shouting. |
| 2. Exploitability | Is anyone exploiting this? CISA KEV, or EPSS ≥ 10%. | The large majority — high-severity CVEs with no observed or predicted exploitation. |
| 3. Reachability | Does our code call the vulnerable path? | Vulnerable libraries you use, but not the vulnerable part of. Checked automatically when a repo is linked. |
| 4. Determination | Have we already ruled on this? | Anything you marked not affected. A not affected ruling is an exception: it names an accountable owner and carries an expiry (default 90 days, at most 365) — when it lapses the finding comes back for re-review, marked Exception expired, so a snooze is never silent or permanent. The ruling is exported as OpenVEX (GET /api/runs/{run_id}/vex) and carries into future scans until it expires. |
What's left is the actionable set: known-exploited or likely-to-be-exploited CVEs whose vulnerable code your app can actually reach, and which you haven't already ruled on. That's the number in the dashboard, the set in the compliance report, and the set ⬆ Update dependencies writes a PR for.
Reading a finding — the labels explained
Every finding is tagged with standard security labels so you can judge the risk and decide what to fix first. Here is what each label means, how to read it, and why it matters.
| Label | What it is & how to read it | Why it matters |
|---|---|---|
| Severity | critical high medium low — our impact ranking. | Your fix order. Address critical and high first — an attacker can cause real damage. Low is hardening. |
| CVE Common Vulnerabilities & Exposures | A specific, publicly-catalogued flaw in a specific software version — usually a third-party library your app depends on. The ID looks like CVE-2026-27962 (year + number); look it up at nvd.nist.gov for details. | The flaw is public — attackers already know it and often have ready-made exploits. The fix is almost always to upgrade the affected dependency to a patched version. |
| CWE Common Weakness Enumeration | The type of flaw, not a specific instance — e.g. CWE-89 (SQL injection), CWE-918 (SSRF), CWE-862 (missing authorization). | Tells you the kind of mistake, so the standard fix pattern is known. |
| CVSS Common Vulnerability Scoring System | A standardised 0–10 severity score. 9.0–10 critical · 7.0–8.9 high · 4.0–6.9 medium · 0.1–3.9 low. | An industry-standard number to compare and rank risk consistently. |
| OWASP LLM Top 10 | The security industry's standard list of the ten biggest risks specific to AI/LLM apps, coded LLM01–LLM10 (full list below). Every AI-specific finding maps to one. | Puts your risk in a framework auditors, engineers, and insurers recognise. |
| MITRE ATLAS | The attacker's playbook for AI systems — the AI counterpart of MITRE ATT&CK. Each finding maps to the technique an attacker would actually use. | Shows the real-world attack technique behind the finding. |
| EPSS Exploit Prediction Scoring System | The probability, 0–100%, that a given CVE will actually be exploited in the wild in the next 30 days. 0.5 means 50%. Applies to dependency CVEs, not app-logic findings. | Severity tells you how bad it would be; EPSS tells you how likely it is. Most high-severity CVEs are never exploited — this is what stops you fixing in the wrong order. |
| CISA KEV Known Exploited Vulnerabilities | The US government's catalogue of CVEs with confirmed, observed exploitation. A finding is either on it or it isn't. | Not a prediction — a fact. KEV means attackers are already using it. Fix these first, whatever the CVSS says. |
| Reachability | Whether your code actually calls the vulnerable path of a flagged dependency — confirmed reachable, not reachable, or not determined. Needs a linked repo. | A vulnerable library you never call the vulnerable part of is not an emergency. This is what turns a wall of CVEs into a short list. |
| PoC Proof of Concept | A working, re-runnable demonstration of the exploit — the exact steps and payload. | The finding is proven, not a guess. If it has a PoC, it is real and reproducible. |
CVE from our automated dependency scan) is a known flaw in a library you use — fix it by upgrading the library. An application finding is a flaw in your own app's logic — prompt injection, broken access control, and so on — fix it by changing your code or configuration.OWASP LLM Top 10 — what each risk means
| Code | Risk | In plain terms |
|---|---|---|
LLM01 | Prompt Injection | Attacker-supplied text overrides the model's instructions or hijacks its tools. |
LLM02 | Sensitive Information Disclosure | The app leaks secrets, personal data, or another user's data. |
LLM03 | Supply Chain | Vulnerable or untrusted dependencies, models, or plugins. |
LLM04 | Data & Model Poisoning | Attacker-controlled data corrupts training, fine-tuning, or the RAG corpus. |
LLM05 | Improper Output Handling | The app trusts model output unsafely — passing it into SQL, a shell, or HTML. |
LLM06 | Excessive Agency | The agent has too much power or access; a manipulated model can act on it. |
LLM07 | System Prompt Leakage | The hidden system prompt — and any secrets or logic in it — can be extracted. |
LLM08 | Vector & Embedding Weaknesses | RAG/vector-store flaws: cross-tenant retrieval, corpus poisoning, embedding leakage. |
LLM09 | Misinformation | False or fabricated output that causes real harm — unsafe reliance, hallucinated code. |
LLM10 | Unbounded Consumption | No limits on use — denial-of-wallet, resource exhaustion, or model extraction. |
Spend caps & safety
Autonomous agents call a language model, which costs money. Two independent limits make sure a scan can never surprise you:
- Per-scan budget cap. Every scan takes a
budget(US dollars, default10). The engine stops when it hits that ceiling. - Token watchdog. A separate backstop kills any scan that blows past a hard token count, even for a self-hosted model the pricing layer can't see. So a runaway loop can't drain your account.
Every scan also runs in its own isolated sandbox, and concurrency is capped per plan so you can't accidentally launch a hundred scans at once.
Authorization & domain verification
Because a scan is a real attack, you may only scan an app you own or are authorized to test. To make that more than a promise, the first time you scan a new public domain we ask you to prove you own it — one time per domain. This stops anyone from pointing us at a competitor.
Verify by either method (pick whichever you can reach — you only need one):
- Meta tag (easiest). Add a line to your homepage's
<head>. Most site builders — Wix, Squarespace, Webflow, Shopify — have a "header code" or "site verification" box for exactly this:<meta name="millenniums-verification" content="YOUR-TOKEN"> - DNS TXT record. Add a TXT record at your domain registrar:
millenniums-verification=YOUR-TOKEN
Verifying the root domain covers all its subdomains — verify acme.com once and you can scan staging.acme.com, api.acme.com, and the rest. You'll also confirm a short authorization certification (that you own the app, or are authorized to test it) before the first scan runs.
localhost, a private IP, host.docker.internal — need no verification. That's your own machine.Verify in the app when prompted, or over the API at POST /api/domains/verify. Discovery (reading a public page) needs no verification — only scanning does.
Your data
Your code and scan results are yours. Each scan runs in a throwaway sandbox that is destroyed when the scan finishes, so we hold as little of your code as possible and only for as long as the scan needs it. We never use your code or results to train any model. Full details, including sub-processors, are in the Trust Center and Privacy Policy.
Traceability report
Every scan produces a chain-of-custody report so you can prove — to yourself, a customer, or an auditor — exactly what happened to your data. It's not a marketing claim; each line is derived from a recorded event in the scan's lifecycle.
The report includes:
- A timestamped timeline: scan created → source received → isolated sandbox launched → scan finished → sandbox torn down → (for uploads) uploaded source deleted.
- Source provenance: whether the scan was black-box (live target only), or white-box from an upload or a git repo. Git URLs are recorded by host only — no paths or credentials.
- Attestations: isolated sandbox, sandbox torn down (verified against the container runtime), uploaded source deleted, spend cap enforced, and never used to train a model.
- Usage: tokens and LLM calls for the run.
Get it in the app on any run under Data trail — chain of custody (with a one-click JSON download), or over the API at GET /api/runs/{run_id}/trace.
Continuous scanning & drift
What: turns a point-in-time scan into ongoing coverage. Register your app as an asset, put it on a schedule, and MILLENNIUMS.AI re-scans it for you — and re-checks whenever it changes.
How: two controls, set per asset in the Continuous view (or over the API):
- Schedules — a daily, weekly, or monthly cadence. Re-scans run down the same path a manual scan does, so your quota, concurrency, and spend caps all still apply.
- Drift detection — turn on watch changes and, between scheduled runs, we re-fingerprint the app (preferring its OpenAPI/Swagger spec). A material change kicks off an out-of-cycle scan. Fingerprints ignore CSRF tokens, nonces, timestamps, and cache-busters, so a dynamic page doesn't false-trigger.
Why: apps change every release, and a yearly pentest can't see a hole a Tuesday deploy opened. Continuous scanning catches regressions when they land; drift means you only spend a scan when something actually changed — hands-off monitoring instead of a calendar reminder.
Tools: the same scan engine driven by a per-asset scheduler; app fingerprinting from the OpenAPI/Swagger spec (or a normalized surface crawl), diffed between runs with dynamic-token noise filtered out.
Dashboard & trends
The home Dashboard is the risk read, not the activity log. It opens on a risk band of four tiles — proven attack paths (of how many risks, from how many open findings), open findings by severity with the opened / resolved delta against the previous scan, coverage (registered assets, cloud connection, endpoint hosts, age of the last scan), and Agent Trust Fabric state (safe / unsafe / degraded agents, or off). Beneath it, the top three attack paths from Redthread are drawn as hop chains — Internet → web-01 → data-ingest-role → customer-records — each marked Proven · PoC or Potential, ranked by severity, proven before potential. Recent scans sit below.
Every tile is a saved query: clicking it opens the view that produced the number, already filtered — a severity bar opens Findings on that severity, a path opens the ranked risk it came from, coverage opens Targets, the trust tile opens Assess. Open-finding counts are taken from the latest scan of each registered asset (a rerun never double-counts); a workspace with no registered assets reads its latest scan instead. The figures come from /api/cloud/risks, /api/overview, /api/cloud/status, /api/endpoint and /api/trust-signal/status.
Below the paths sit three more panels. What changed since last scan lists each registered asset with its opened / resolved count against the previous scan and its next scheduled run — assets with newly opened findings sort first, and a row opens that asset's latest scan. Next actions is derived from state you already have: auto-fix pull requests ready to merge, shadow-AI candidates waiting to be confirmed, exposed credentials to rotate (from ranked risks), and the proven path to fix first. Open findings · 8 weeks is a sparkline summed across your registered assets (each asset's latest open count carried forward week to week, from /api/assets/<id>/trend), with a ↑ / ↓ arrow against the prior week that is repeated on the severity tile; it appears after the second scan of a registered asset.
Executive view. The Analyst / Executive toggle at the top of the Dashboard switches the same numbers one altitude up: the proven-path figure with its funnel line, a plain-language summary written from the current state (what Redthread maps, what is proven, open findings by severity, the change since the previous scan, agent trust, and the next action), then coverage, trust, severity and the 8-week trend, and the top attack paths. Scan mechanics are hidden. Executive is the default view; the Analyst view is one click away and the choice is remembered in the browser.
Saved views. On a scan's Findings, the severity / PoC / exploited chips filter the list; + Save view keeps the current severity filter and dismissed-toggle under a name, per workspace in your browser, and the saved views appear as ★ chips beside the filters.
The console navigation is grouped by what you are doing rather than by scan type: Overview (Dashboard) · Connect (the scan types; registered targets are managed under Settings → Targets) · Explore (Redthread Flow, Chat, Knowledge) · Handle (Findings, PR Reviews) · Govern (Assess & Consolidate, Settings).
The Continuous view rolls up every registered asset in one place, so a security lead — or a board — can see the whole estate at a glance and prove it is moving in the right direction. It is fed entirely by the scans your schedules and CI already run; there is nothing extra to instrument.
Per-asset rollup — GET /api/overview. Each asset shows its latest scan status, findings by severity, the opened / resolved delta versus the previous scan, and its schedule and next run. You see not just where an asset stands, but what changed since last time.
Risk trend — GET /api/assets/<id>/trend. Every asset carries a findings-over-time series — each scan oldest → newest, with the open count and the number opened and resolved at that step — so you can show risk trending down over weeks, not just a single snapshot. This is the sparkline behind the dashboard.
Export — GET /api/overview.csv. One click exports the whole-org rollup as CSV for a spreadsheet, a QBR deck, or your own BI.
Shadow-AI discovery (AI inventory)
What: finds the AI your organization is using that security doesn't know about — "shadow AI." Repositories quietly calling an LLM API, managed AI services switched on in a cloud account, self-hosted model servers or chatbot UIs exposed on your domains. It is a discovery and inventory capability: it tells you where AI exists, not whether it's vulnerable.
How: connect the surfaces you want looked at, and each run reports exactly what it covered. Every result is a candidate you confirm — it never registers anything on its own. Confirmed candidates merge into one deduped AI inventory with a coverage banner; dismiss the ones already known or out of scope.
| Surface | How it's connected | Finds |
|---|---|---|
| Repos | a GitHub org / account | AI-powered repositories, by their LLM-SDK usage. |
| Cloud | an agentless role / inventory | Managed AI services — Bedrock agents, knowledge bases, provisioned models, SageMaker endpoints, Lex bots, Comprehend. |
| External | your domains | Exposed AI surfaces — self-hosted model servers (Ollama, vLLM, TGI), OpenAI-compatible endpoints, chatbot UIs. |
Why: you can't secure or govern AI you don't know you have. Shadow AI is where data leakage, runaway cost, and compliance gaps hide — an inventory is the first control. What you confirm here becomes the set that gets tested and monitored. See Discovery & inventory.
Tools: GitHub org/repo API + LLM-SDK usage detection (repos); agentless cloud enumeration via boto3 — Bedrock, SageMaker, Lex, Comprehend (cloud); HTTP/TLS surface probing for model servers and OpenAI-compatible endpoints (external). All agentless.
AI supply chain
What: the risk that comes from the AI components your app is built on — third-party foundation models, fine-tuned or pretrained weights, training and RAG datasets, embeddings, plugins/tools, and the ML/LLM libraries and model registries in your stack. A poisoned model, a backdoored dataset, a typosquatted model on a hub, or a vulnerable ML dependency can compromise your app before you write a line of code. This is OWASP LLM03:2025 Supply Chain.
How: during a scan the agent inspects the AI components in scope — where models and datasets come from and whether that source is trusted, how plugins/tools are wired and how much they're trusted, and the dependency tree of your ML/LLM stack. Dependency CVEs are triaged by real exploitability (KEV / EPSS) and reachability, so you see the ones that actually matter rather than a wall of noise.
Why: your AI app is only as trustworthy as the models, data, and libraries it inherits — and those come from outside your codebase, bypassing your app-level controls. It's on the OWASP LLM Top 10 for exactly that reason.
Tools: osv-scanner for the dependency CVE inventory, then the EPSS / CISA-KEV / reachability triage funnel (see Dependency CVEs); our LLM skill pack maps findings to OWASP LLM03 and MITRE ATLAS AI Supply Chain Compromise (AML.T0010).
Infrastructure & Cloud
What: cloud security posture management (CSPM). Beyond the app, it checks your cloud for the exposures attackers hunt for — public buckets, over-broad IAM, ports open to the world, unencrypted or public data, and blind spots in your audit trail. agentless, CVSS-scored.
How: connect an agentless role and we assume it, enumerate agentless, and run deterministic checks — no keys, no write access. A finding fires only on a resource that actually fails a check.
| Check | Severity | CVSS |
|---|---|---|
| S3 bucket public access | Critical | 9.8 |
IAM wildcard policy (Action:* on Resource:*) | Critical | 9.1 |
| Security group open to all ports | Critical | 9.8 |
| SSH / RDP open to 0.0.0.0/0 | High | 8.1 |
| RDS publicly accessible | High | 7.5 |
| RDS / S3 unencrypted at rest | Medium | 5.3 |
| CloudTrail logging disabled | Medium | — |
| Lambda function URL with no authentication | Critical | 9.1 |
| EKS API endpoint open to the internet | Critical | 9.0 |
| Cross-cloud federated trust with no subject condition | Critical | 9.6 |
| Secret with automatic rotation disabled | Low | 3.1 |
AWS in two clicks, no command line. Press Open AWS and create the role: it opens the AWS CloudFormation console with everything filled in — our scanner, your unique external ID, and a read-only role (ReadOnlyAccess + SecurityAudit) named millenniums-cloud-scan. Tick the IAM acknowledgement box, click Create stack, wait about a minute, then type your 12-digit AWS account number back in the app. We build the role ARN ourselves and prove it with one real read-only call before storing anything; if the stack is still creating you're told to wait and retry, not handed an error. To revoke, delete the MillenniumsCloudScan stack. Already created millenniums-cloud-scan earlier (for example with the Terraform)? The stack will report that the role already exists — skip it and just enter your account number; the existing role works as long as it trusts our scanner with your external ID. The template is public and short — read it before you run it: millenniums-cloud-scan-v1.yaml. Prefer Terraform or your own role? The Infrastructure page still generates the Terraform and takes a role ARN.
Not the person who manages AWS? From the Estate Scan page, Get a link to send them creates a private link that opens those same two steps for whoever runs your AWS — no account needed on their side. It can do exactly one thing: connect AWS for your workspace. It shows only your company name, never your email or findings; it expires after 7 days; and making a new link cancels the previous one. Your Estate Scan lane turns green when they finish.
Azure and GCP connect automatically too. Azure: an app registration with Reader + Security Reader. GCP: a service account with Viewer + Security Reviewer. Every credential is verified with a real read call before it is stored, so a typo fails at connect time rather than silently at 3am. Secrets are write-only — never returned by any screen or API. Kubernetes and any Prowler inventory can still be ingested directly. See the API.
Why: your app can be flawless and still be breached through the infrastructure it runs on — and posture drifts every time a team ships. Because it's agentless, it's safe to run continuously, not once a quarter.
Tools: agentless cloud enumeration via boto3 (AWS) against a role you grant (ReadOnlyAccess + SecurityAudit), then our deterministic, CVSS-scored posture checks. Any Prowler-format inventory can be ingested instead, and the same checks run for GCP / Azure / Kubernetes.
Redthread — risk graph & attack paths
Redthread is our graph engine. It is the layer underneath the attack-path report, the pull-request gate, the query builder and the runtime sensor — all four read and write the same graph, which is why they never disagree with each other.
What: every asset, identity, network route and finding across your clouds, in one normalized graph — and the ranked list of attack paths through it. A finding says "this bucket is public." A risk says "the internet reaches this workload, which holds a credential, which reads your customer data." The path is the product.
How: provider terminology stops at the collector. An AWS role, an Entra ID service principal and a GCP service account all become the same kind of node, so a path can cross a cloud boundary. Eight rules run over the result — exposed workload → sensitive data, credential chains, cross-cloud pivots, privilege escalation, shadow data, exposed AI assets, and proven cross-layer chains. Each returns a path, not an alert.
Why: posture tools produce hundreds of criticals and no priority. Ranking by CVSS alone tells you nothing about whether an attacker can actually get there. Reachability is the priority, and reachability only exists in a graph.
Tools: Redthread is the engine; the file is not proprietary. The graph is emitted in graphify's node-link format, so you can traverse it yourself — graphify path "internet" "customer-data" — or download it from the Risks view. No graph database to run, and no lock-in: if you leave, the graph leaves with you.
Redthread Flow — reading the graph
Redthread Flow is the console panel where you ask the graph a question and get the answer drawn rather than listed. It sits in the left-hand nav, directly under Dashboard.
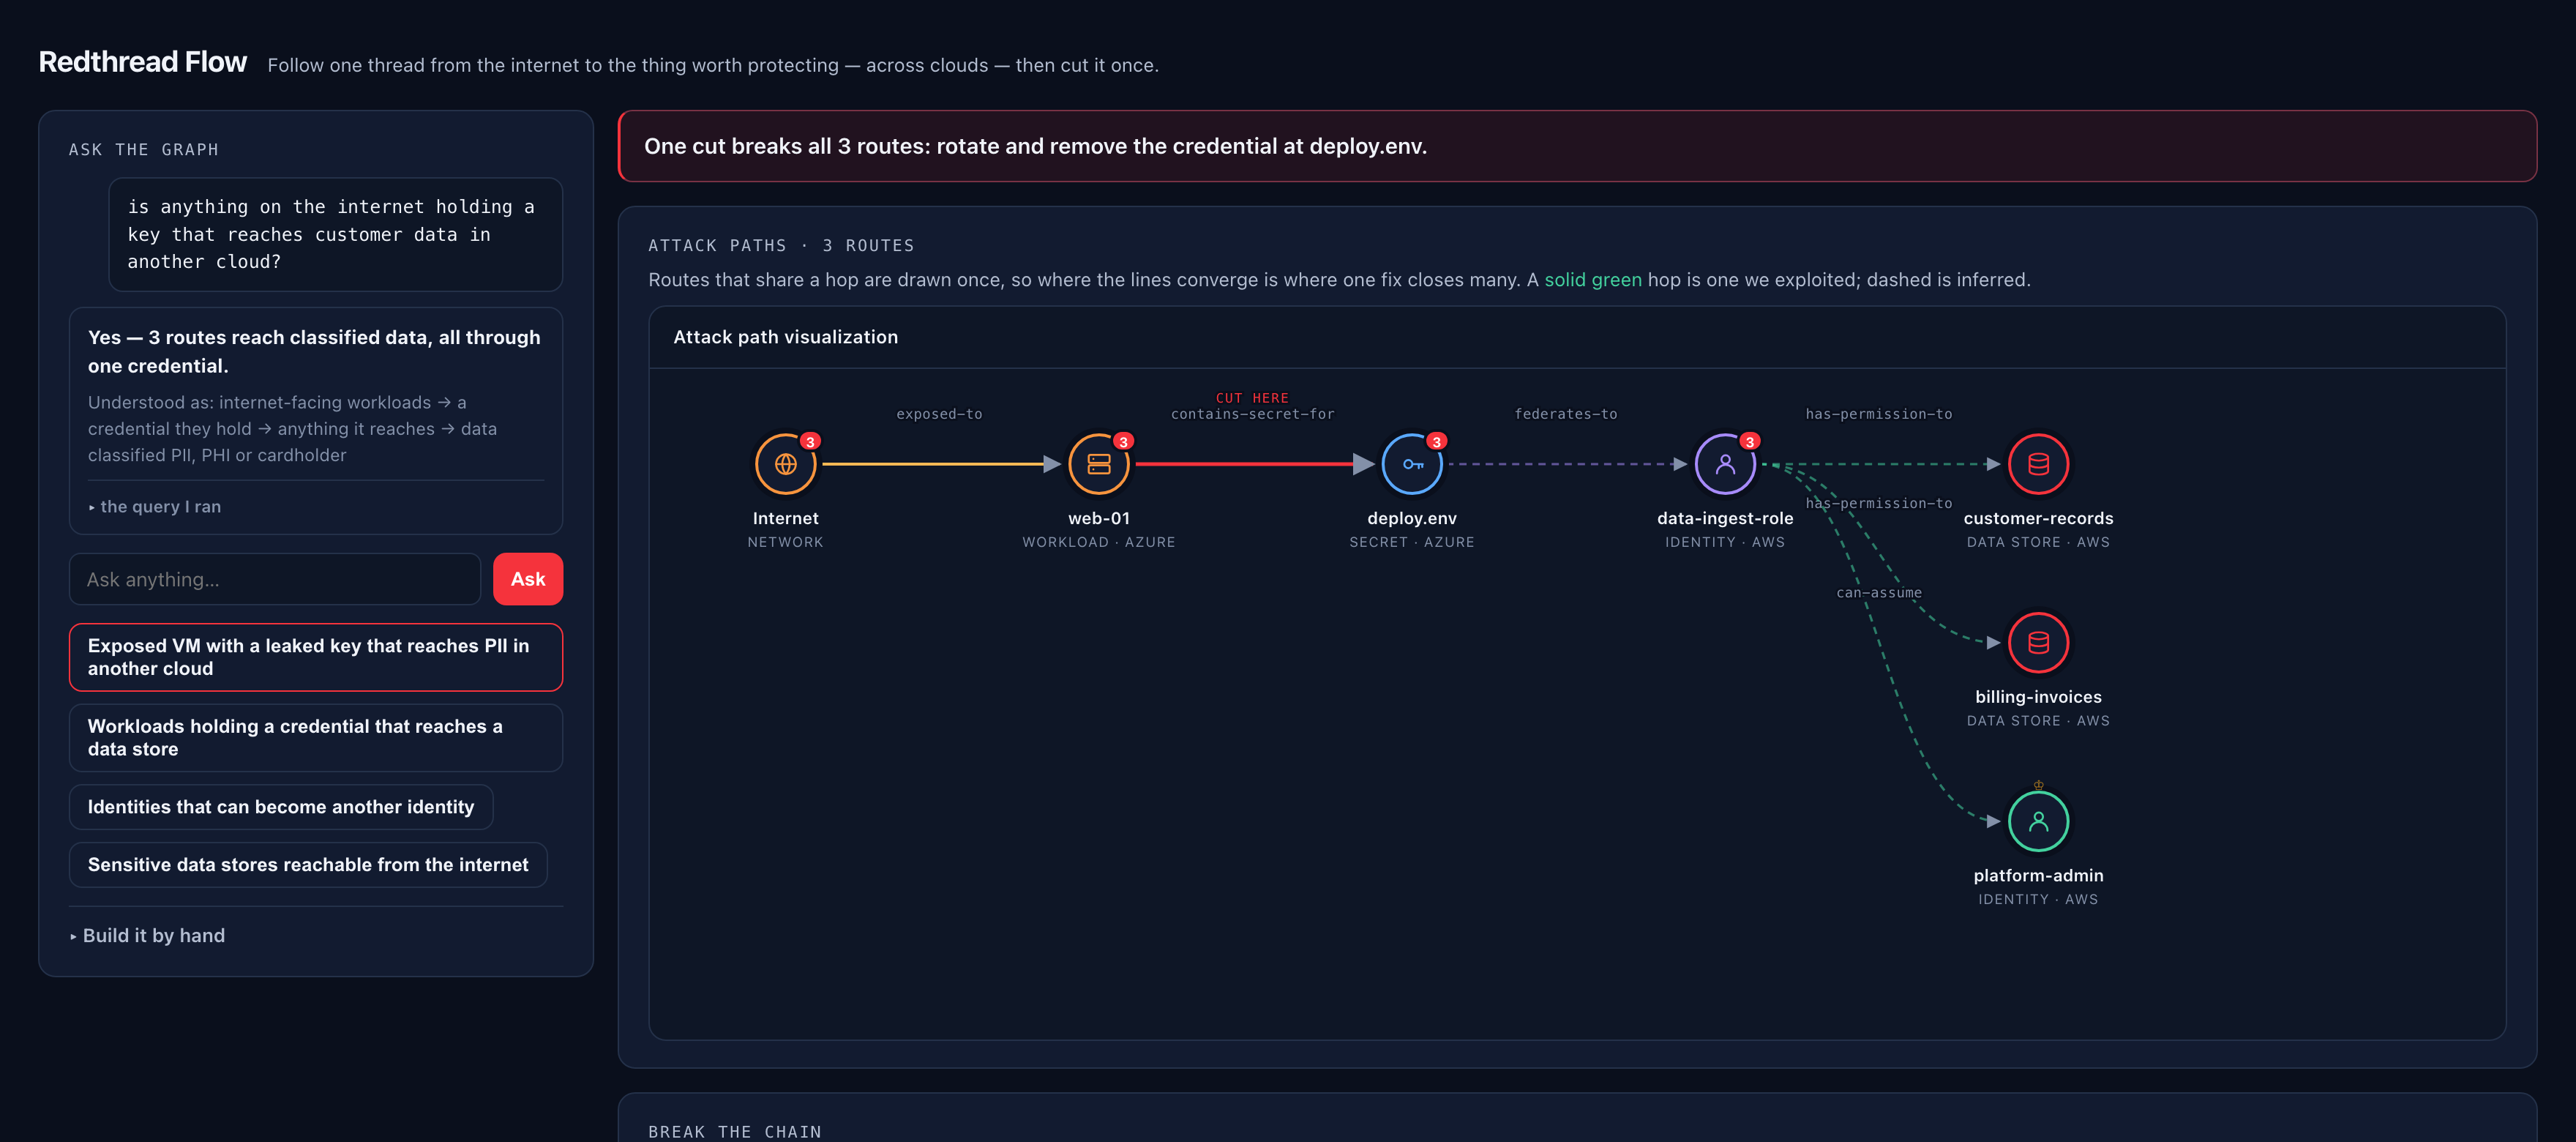
Using it
The panel opens with a graph already drawn. It runs the saved questions in order and stops at the first that returns a path, highlighting which one it chose — so you land on a real answer rather than an empty canvas. There are three ways to ask your own:
- Plain English. Type a question — "is anything on the internet holding a key that reaches customer data in another cloud?" — and press Ask. A model translates it into a structured graph query. The query it ran is always shown under "the query I ran": expand it and confirm it understood you. If the question is outside what the graph can express, it says so and names what is missing, rather than running the nearest query that happens to validate. An answer to a question nobody asked looks exactly like an answer.
- Saved questions. The buttons below the box are the common ones, already written: exposed VM with a leaked key that reaches PII in another cloud, workloads holding a credential that reaches a data store, identities that can become another identity, sensitive stores reachable from the internet, and others. Click one to run it.
- Build it by hand. Expand Build it by hand for dropdowns: find [asset kind] in [cloud] that is [exposure], connected by [relationship], to [asset kind] holding [data classification]. No query language to learn.
Questions are rate-limited per hour by plan — 10 on Free, 40 on Starter, 120 on Growth, 400 on Enterprise — because each plain-English question costs a model call. Saved and hand-built queries run against the graph directly and are not limited.
Reading the picture
The drawing is a layered flow, left to right: the direction of the arrows is the direction of the attack. The leftmost column is where an attacker starts — usually the internet — and the rightmost is what they reach.
| What you see | What it means |
|---|---|
| A circle | One asset. The icon is its kind — workload, identity, data store, secret, network, AI asset, code, finding. The label under it is its name; the small caps line beneath is its kind and cloud. |
| A line between circles | A relationship that an attacker can traverse — exposed-to, contains-secret-for, federates-to, has-permission-to, can-assume, runs-on, stores, routes-to. The relationship is printed on the line. |
| A solid line | Proven. Our engine executed this hop and it worked. The request and evidence are attached. |
| A dashed line | Inferred. The hop exists in your configuration but was never executed. Real, but not demonstrated — and never presented as if it were. |
| A red line marked CUT HERE | The chokepoint: the single hop that appears in the most routes. Cutting it closes all of them at once. |
| A red ring | The asset holds classified data — personal, health, cardholder or credentials. |
| An amber ring | The asset is internet-facing. |
| A crown | A privileged identity — an administrator. |
| A number badge | How many of the drawn routes pass through that node. A high number is a convergence point, and convergence is where one fix is worth many. |
| Warm to cool colour | Depth along the chain: entry is warm, the data at the end is cool. Role colours win where they carry meaning — internet-facing stays amber, classified data stays red. |
Break the chain
Below the graph is the ranked cut list. Every hop in the full result set is scored by how many routes die if you cut it, and each row states the action (rotate and remove the credential, narrow the permission, close the exposure), why it works, and the evidence. The number on the left is routes broken. On a live AWS account the top cut — rotating one credential on one role — closed 86 of 1,382 paths.
What "no path matches that" means
An empty result is an answer, not a failure. Nothing in the current graph connects those things. Two honest caveats: coverage is whatever you have connected, so a path we cannot see is not a path that does not exist; and data classification is never inferred — a store stays unknown until DSPM samples it or you label it, so classification-filtered questions correctly return nothing on an account that has not been classified yet. Run a scan with classification enabled and they start answering.
Attack path analysis — what it is
Attack path analysis maps the routes an attacker could use to move through your environment and reach the assets that matter. It exists because individual scans produce thousands of findings without showing which of them chain into something exploitable. A misconfiguration alone is rarely a breach; a misconfiguration plus a weak permission plus an exposed host is.
Four steps, and we run all four:
- Asset and risk discovery. Full agentless visibility of workloads, identities, configurations and data — plus vulnerabilities, exposed secrets, misconfigurations and excessive permissions. On a mid-sized AWS account this is typically several hundred assets and tens of thousands of permission relationships.
- Graph-based mapping. Those risks are placed onto one graph that connects the resources and shows how they relate — a workload with a public IP and a critical vulnerability, linked to an over-privileged identity. Every edge carries a confidence: proven, extracted from configuration, or inferred.
- Path identification. The graph is searched for toxic combinations — sequences where several individually low-severity issues chain into a high-impact route to something valuable. Eight rules run over it, each returning a path rather than an alert.
- Prioritisation. Paths are ranked by severity, then proven before theoretical, then how direct the path is, then blast radius. A route to a crown-jewel asset or to elevated privilege ranks above one that ends somewhere harmless.
A note on how the search works, because it changes the answers. A plain shortest-path search finds the shortest route to each target — which is frequently not the route that matters. A publicly readable bucket is reachable in one hop, and that one hop hides the three-hop credential-theft chain that reaches the same bucket. So a rule that depends on a specific kind of hop searches through that hop explicitly, and the chain is reported rather than masked.
Cross-cloud risk
What: the attack paths that begin in one cloud and end in another — the ones neither provider's own tooling can see, because each only looks at itself.
How: we read the trust relationships that actually cross the boundary: an AWS role whose trust policy names an Entra ID or Google issuer, a GCP workload-identity pool trusting an AWS account. Both sides must agree before an edge exists — a granted permission alone is never enough.
sts.windows.net/<tenant> proves AWS trusts that Azure identity whether or not you have connected Azure. Connect one cloud, still see the cross-cloud exposure.On the graph: a confirmed cross-boundary trust becomes a can-assume edge between clouds, and any attack path that crosses it is ranked as a T3 — cross-cloud pivot risk on GET /api/cloud/risks, with the full edge-by-edge path and its evidence, ordered proven-before-potential. Because the graph exports as open node-link JSON you can also traverse it yourself: graphify path "aws-prod" "azure-tenant" --graph graph.json.
The over-broad trust is its own finding. A role whose trust policy has no sub (subject) condition trusts every identity in that external tenant, not the one you meant — easy to ship by accident when copying an OIDC snippet, and a critical finding on its own even before any path is drawn.
Why: federated identity is how teams avoid long-lived keys — and it is also how an attacker moves between your clouds. Neither AWS, Azure, nor GCP flags a trust the other side extended, so this is exactly the blind spot single-cloud posture tools leave open.
Tools: AWS IAM trust policies, Entra ID via Microsoft Graph, GCP workload-identity federation. Issuers are identified, never guessed — an unrecognised issuer produces no cross-cloud edge, because a mislabelled one is worse than a missing one.
Data security posture (DSPM)
What: what is actually in your data stores — personal data, cardholder data, health data, credentials — and where a copy of production has quietly ended up.
How: two tiers. Bounded sampling reads a small, capped sample of objects through the same agentless role you already granted — no snapshots, no extra permissions, nothing installed. For unmanaged databases living on a VM disk, an ephemeral snapshot worker runs inside your account, mounts a snapshot agentless, and transmits findings only — never a value, never file contents, never a row — then terminates.
Shadow data: stores are schema-fingerprinted, so a production schema sitting in a staging bucket is flagged as a copy worth reviewing — and escalated to critical when that copy is also internet-exposed.
Why: severity is meaningless without knowing what is at stake. A public bucket of CSS files and a public bucket of customer records are the same finding and completely different risks. Classification is what separates them — and it is why we never guess: an unlabelled store stays unknown, never assumed safe and never assumed sensitive.
Tools: pattern + entropy classifiers with validity checks (Luhn, SSN structure), column-name corroboration, and schema fingerprinting for lineage. Bounded per object and in total; coverage is reported as what was actually sampled, never extrapolated.
Code-to-cloud — stop it before it ships
What: a check on every pull request that reads your Terraform, CloudFormation, ARM and Kubernetes manifests and fails the build when a change would create a real problem.
How: the planned resources are merged into your live risk graph, and we report what the change would introduce — not what your account already looks like. Findings post back to the pull request as a single comment that is edited on each push, never a new one each time.
The gate blocks on exactly what your diff is responsible for: a critical misconfiguration it declares, an attack path it introduces, or a credential it commits. Pre-existing account risk never blocks a pull request — that is how a gate gets switched off. Report-only mode is a one-line change.
Why: the cheapest moment to fix a misconfiguration is before it exists. Everything after that is remediation, a change window, and an argument about priority.
Tools: a real HCL parser (not line matching), plus CloudFormation / ARM / Kubernetes. Secret scanning excludes placeholders and variable references — a scanner that flags password = var.db_password trains people to ignore it. Ships for GitHub Actions and Azure DevOps; authenticates with a per-asset key, never your account token.
Ask the graph
What: saved questions and a query builder for the ones we did not anticipate — "show me every internet-exposed VM holding a plaintext key that grants access to a store containing personal data."
How: pick a kind of asset, filter on its attributes, then follow a relationship to what it can reach. Results are paths with the evidence for each hop, not a list of names.
Why: your questions during an incident are not the ones a vendor pre-wrote. Free-text search cannot express "A and B and reaches C" — that is set membership and reachability, which needs the graph.
Tools: a closed, safe query form — a query is data, never code, with validated relations and bounded traversal, so it can neither be turned into code execution nor hang on a large estate.
Remediation & ticketing
What: a signed webhook when a risk matches your rules — wired to your own automation, or straight into Jira or ServiceNow with the attack path in the ticket.
How: you register a workflow with POST /api/workflows — { name, url, kind: "webhook|jira|servicenow", rules: ["T2"], min_severity: "critical", proven_only: false, auth_header }. A delivery fires only when a risk matches all of your filters: one of the named graph rules (T1–T8), at or above min_severity, and — if you set proven_only — only when the path was actually exploited, not merely reachable. The signing secret is returned once and never again; POST /api/workflows/<id>/test fires a synthetic delivery so you can prove the wiring before a real event.
Verify every delivery. Each request carries an HMAC signature in the X-Millennium-Signature header over the raw body; recompute it with your secret and reject anything that does not match. Deliveries are replay-bounded (a timestamp + nonce), and destinations must be HTTPS resolving to a public address — a webhook can never be aimed at an internal service or a cloud metadata endpoint.
X-Snapshot-Key) and has no path to a value.Prevention, upstream: the same risk graph powers the code-to-cloud PR gate — POST /api/iac/scan fails a pull request that would introduce a critical attack path against your live graph, so the cheapest fix (never merging it) happens before there is anything to remediate.
Why: a security vendor holding write credentials across your cloud is a single point of catastrophic failure, and the hardest thing to get through a security review. Splitting detection from execution removes both problems.
Runtime sensor Enterprise add-on
What: optional eBPF detections from your nodes, landing on the same risk graph as everything else.
How: a Falco DaemonSet plus an outbound-only forwarder. Enable it in the app, enrol a sensor, deploy with the command shown. Turning it off revokes every sensor immediately.
Why: configuration drifts and a workload can be compromised without a single setting changing. Provider threat feeds catch a lot of that with no agent at all — this is for teams who have decided that sub-minute, in-kernel visibility is worth a privileged DaemonSet, and it is deliberately their decision rather than our default.
Detection, not prevention. It never blocks, kills, or quarantines. The rest of the platform installs nothing on your servers; this deliberately does, which is why it is a separate add-on and off by default. If you would rather stay fully agentless, GuardDuty, Defender for Cloud and Security Command Center findings are ingested onto the same graph with no agent at all.
Tools: Falco (CNCF) for the eBPF probe and rule set. The forwarder — the component holding your key — is unprivileged and drops all capabilities. Ingest is capped; over the limit, events are dropped and counted, never lost silently.
Network penetration testing — the phases
What: testing the network your app runs on — internet-facing and internal — for the openings an attacker uses: exposed services, weak configuration, missing segmentation, and (once certified) exploitable paths. It ships in four phases, P1–P4.
Why: the app is one layer; the hosts, ports, and internal network around it are a separate attack surface — and the one a real intruder pivots through. Confirm-only by default, so you get the coverage without the risk.
How: every phase stays behind the same pre-engagement gate — an explicit scope, proven ownership, and a signed Rules of Engagement (no-DoS by default) — with an always-visible Emergency Stop while a scan runs. The four phases, each with its own What / How / Why:
P1 · External confirm-only live
What: a self-serve, confirm-only assessment of your internet-facing IPs and ranges — host discovery, port and service scan, service enumeration, and non-intrusive vulnerability checks. It confirms exposures; it does not exploit them.
How: in the Network tab, define a scope (IP/CIDR, /24 or narrower), prove you own each public target (host a token at /.well-known/millenniums-scan-authorization), sign the Rules of Engagement, then launch. Findings are CVSS-scored and mapped to PCI DSS 11.4 / SOC 2.
Why: the outsider's view — what an attacker sees before any foothold. Fast, safe, and authorized, so you can run it on demand instead of scheduling a yearly engagement.
P2 · Internal connector live
What: the assumed-breach view — testing internal assets an external scan can't reach (flat networks, exposed internal services, lateral-movement paths).
How: enroll a connector in the Network tab (one-time key + a docker run command) and run it on any host inside the segment you want tested. It is outbound-only — no inbound ports — heartbeats to the platform, runs the Tier-1 scanners locally against your authorized scope, and streams findings back over HTTPS. No LLM key or data leaves your box beyond the findings; the platform does the reasoning and report.
Why: external scanning only sees the edge. Real internal risk needs something on the network — deployed by you, so the connector's presence is itself the authorization.
P3 · Credentialed & Tier-2 sweep live
What: two additions. Credentialed scanning tests what a phished or insider account can reach, using low-privilege credentials you supply. Tier-2 sweep is a broader, rate-capped active scan above the confirm-only default.
How: add credentials (SSH/SMB/web/domain) to the vault in the Network tab — stored server-side, masked on every read, injected into the scan sandbox only at run time, never logged. Choose the Rate-capped sweep intensity (behind its own acknowledgement) for broader coverage; asset-class exclusions (fragile/OT devices) and a lockout-aware policy keep it safe.
Why: unauthenticated scanning finds the exposed surface; credentialed testing finds what's reachable with a foothold — the depth auditors and real engagements expect.
P4 · Exploitation (Tier 3) gated — off by default
What: proving real impact by testing weak points — human-gated per target, non-destructive only. Built as a control plane; execution is disabled by default.
How: a fail-closed gate requires all of: a signed enablement certification (legal/insurance/authorization verified), the enablement-readiness checklist complete, a per-target human approval, the target inside a signed authorization, and a non-destructive catalog entry. It runs only after every one of those holds.
Why: exploitation is legally and operationally sensitive. It stays off until an engagement is certified — the gate is enforced in code, not just policy — so the capability can never fire by accident.
Tools: host/port/service discovery with nmap and naabu (and rate-capped masscan at Tier 2); nuclei + its template library and our own non-destructive detection checks for exposures; enum4linux-ng / smbmap for service enumeration. Tier-3 (gated, off by default) draws on a curated, non-destructive subset of metasploit, netexec/impacket, responder, and bloodhound-style AD analysis.
Compliance report & attestation
Every completed scan produces an audit-support report grounded in the standards enterprises test against (PTES, NIST SP 800-115, OWASP WSTG, CREST, CVSS). It ships in three tiers so each reader gets the right cut:
- Letter of Attestation — a redacted, signed one-pager you can hand to your customers, procurement, or third-party-risk reviewers. It has the scope, dates, methodology, and severity counts — no exploit detail. Get it at
GET /api/runs/{id}/attestation. - Full compliance report — executive summary plus per-finding technical detail: Rules of Engagement, a severity heat-map, a remediation roadmap, and an AI traceability matrix mapping each finding to OWASP LLM 2025 → MITRE ATLAS → NIST AI RMF / ISO 42001 / EU AI Act. Cross-mapped to SOC 2, ISO 27001, and NIST CSF.
GET /api/runs/{id}/compliance. - JSON twin — the same data as
report.jsonfor Vanta, Drata, or Secureframe.GET /api/runs/{id}/compliance.json.
Honest scoring. CVSS is a real advisory score for dependency CVEs, or the standard class base vector for a vulnerability class (labeled as such) — never a fabricated number. Behavioral findings (jailbreaks, prompt injection) carry an Attack Success Rate — a real successes/trials figure — when you measure one (POST /api/runs/{id}/measure-asr), because a jailbreak that fires 3 times in 100 isn't one that fires 90.
Tools: CVSS 3.1 scoring; OWASP LLM 2025 + MITRE ATLAS v5.6.0 traceability; framework cross-maps to PCI DSS 11.4, SOC 2, ISO 27001 / 42001, NIST CSF / AI RMF, EU AI Act; OpenVEX for affected/not-affected determinations; and Attack Success Rate reported with a Wilson 95% interval. Optional certified CREST/OSCP human review.
SSO, SCIM & roles
What: enterprise identity for teams — single sign-on, automatic user provisioning and deprovisioning, role-based access, and an audit log. Every asset, scan, and finding is scoped to your workspace.
How: four roles — owner (everything, incl. billing), admin (manage the workspace), member (do the work), viewer (agentless) — plus:
- Single sign-on (OIDC) — your team signs in with your identity provider (Okta, Entra/Azure AD, Google, Auth0); new users in your email domain are provisioned automatically. Owner-configured with an issuer URL, client ID/secret, and your domain.
- SCIM 2.0 provisioning — your IdP creates and, critically, deprovisions users automatically. Deactivating someone in your IdP cuts their access here immediately: their tokens are revoked, not just a flag flipped.
- Audit log — who triggered which scans, and who viewed or exported which reports.
Why: at team scale the risk isn't only outside — it's a former employee whose access never got cut, or an over-privileged account. SSO centralizes sign-in on your IdP's policy (MFA, conditional access); SCIM guarantees off-boarding is instant, not a ticket someone forgets.
Tools: OpenID Connect (OIDC) for SSO — Okta, Microsoft Entra ID, Google Workspace, Auth0; SCIM 2.0 for provisioning/deprovisioning; per-tenant bearer tokens with constant-time comparison and immediate revocation. Enterprise plan. See SSO & SCIM to set it up.
Guide: run your first scan
Goal: go from a fresh account to a proven finding.
Prerequisites
- A verified account (browser quickstart).
- A target URL — a live, running instance of your app that you own or may test. Use a staging URL, not production. This is required; your code alone isn't a running app. Don't have one? See What to point it at.
- Optional: your source — a git repo URL or a
.zipupload, for a deeper white-box scan.
Steps
- Open the app and paste your target into the scan box, or call
POST /api/scan. - If you have the source, add it — a repo URL or local path in the
sourcefield. This is the single biggest lever on finding quality. - Start the scan. Note the
run_id. - Wait for it to finish (status
running→false). Minutes, typically. - Open the report and triage from the top: criticals first.
Troubleshooting
- 403, "verify your email" — click the verification link, or hit "Resend" /
POST /api/resend. - 402, quota reached — you've used your included scans. Add a card / upgrade (plans).
- 500, "scan did not start" — the engine couldn't launch (Docker or the model key). For self-hosted, check your
.env; on our hosted app, retry. - Zero findings on a URL-only scan — provide
sourceand re-run. Black-box alone often misses AI-specific paths.
Guide: register a target
If you scan the same app repeatedly, register it once on the Targets tab instead of pasting it in every time. Each target remembers its own settings, so a re-scan is a single click on Scan now. Registered targets are also what the CI plans scan automatically on each pull request.
What each field does
| Field | What it does |
|---|---|
| Name optional | A label so you can recognise the target in the list. Defaults to the target itself. |
| Target | The app to test — a URL, a code repository, an IP address, or a domain. Always aim at staging, never production (see What to point it at). |
| Source repo optional | A link to your code repository. Adding it turns on white-box testing — the scan reads your source, which finds far more real bugs than testing only from the outside (see Black-box vs white-box). |
| Focus / instructions optional | Steer the scan in plain English — the areas to focus on (e.g. “login and payments”), test credentials to sign in with, or specific pages to probe first. |
| Scope | Full scan, or Changed files only — a faster, cheaper re-scan that looks at just what changed. Available when the target is a code repository or you’ve added a Source repo. |
| Base ref changed-files only | What to compare against — a branch, tag, or release. Leave it blank to compare against the repository’s main branch. |
What happens when you click Scan now
- Your settings are checked, and anything that can’t work is caught right away — for example Changed files only needs a code repository, so you’re told before the scan starts rather than after it fails.
- Your plan and spend cap are applied, so a scan can never run past your budget (see Spend caps & safety).
- The test runs in a throwaway, isolated sandbox — your code is never reused or kept (see Your data).
- When it finishes, the results appear under Findings (see Read your scan results).
Guide: read your scan results
When a scan finishes, open it from the Scans list. Its results appear under Findings, organised into tabs so you never have to scroll to reach a section.
The tabs
| Tab | What's in it |
|---|---|
| Findings | Every vulnerability the scan proved, as cards you can expand. Where you'll spend most of your time. |
| Dependency CVEs | Known flaws in your third-party libraries (from an automated dependency scan), kept separate from the app-logic findings. Exploitable ones are auto-checked for reachability — whether your code actually calls the vulnerable path — and the unreachable ones are suppressed, with an OpenVEX export (⬇ VEX) of those determinations for your auditors. |
| Penetration Test Report | The formal written report (produced only when a scan runs to completion). Share it, download a branded PDF, or the raw .md. |
| Data Trail | The chain-of-custody record — proof your code ran only in a throwaway sandbox, was never used to train any model, and was deleted when the scan ended. |
Filter the findings
A large scan can surface hundreds of findings. The coloured pills above the list let you focus — click one to filter, click ✕ clear filter to see everything again:
- Severity pills — Critical High Low — show only findings at that level. A big scan opens focused on the most severe by default, so the worst is in front of you first.
- ⚡ PoC — show only findings that come with a working, proven exploit (the highest-confidence ones).
Every finding is also adversarially re-checked before it's shown: anything the scanner judges a likely false positive is hidden by default (a toggle brings it back so you can review the call yourself).
Read one finding
- Start with Critical and High — those are what an attacker reaches soonest.
- Open "Proof of concept" to see, in plain steps, exactly how the vulnerability is exploited. On paid plans, expand ▸ Exploit script for the actual runnable exploit so an engineer can reproduce it.
- Read "Remediation" — the concrete fix — and the code locations.
- Fix it (see the next guide) and re-scan to confirm the hole is closed.
Guide: fix what the scan found
On the Starter plan and above, with GitHub connected, MillenniumsAI can draft the fixes for you as pull requests — you review and merge; nothing changes on its own. Two one-click actions sit in the top row of a completed scan.
Before you start
- You're on the Starter plan or higher.
- You've connected GitHub (Integrations tab), and the scan used a GitHub repository as its source.
- The scan has completed — a scan that stopped early can be Resumed to completion first.
1. Fix your own code — ⚙ Generate fix PR
For application findings — flaws in your code, like broken access control or injection:
- Open the completed scan and click ⚙ Generate fix PR in the top row.
- It locates the code behind each finding, writes a minimal fix, and opens a draft pull request on your repo.
- Click ↗ View fix PR to review it on GitHub.
- Fix not quite right? Click ↻ Regenerate and tell it what to change or preserve (e.g. "keep the existing session check"). It retries with your guidance and updates the same PR — no duplicates.
2. Fix vulnerable libraries — ⬆ Update dependencies
For dependency findings — known CVEs in the third-party libraries your app relies on:
- Click ⬆ Update dependencies in the top row.
- It bumps each vulnerable package to its patched version in your editable manifests (
requirements.txt,package.json) and opens a draft PR. - Vulnerabilities pinned in a lockfile (
package-lock.json,poetry.lock,uv.lock) can't be safely edited by hand — the PR lists each with the exact command to run (e.g.npm install axios@1.6.0). - Review the changes, run any listed lockfile commands, and merge.
3. How a fix is produced — and how we check it
What: three stages, cheapest and most certain first. Nothing reaches your pull request that only its own author approved.
- Deterministic codemods. For the patterns we see repeatedly —
yaml.loadwithout a loader,verify=False, Flaskdebug=True, Jinja2 with autoescape off — a hand-written transformation replaces the model entirely. Same input, same output, every time. The change is located with a Python AST (the exact node, not a lucky regex) and applied by column offset, so your comments, blank lines and formatting survive. - A model, only for what no codemod covers. Because our application findings are black-box, there is no file and line to edit — we take the identifiers a finding actually names, locate them in your source, and patch there. Vendored, bundled and minified files are excluded, so nothing is ever “fixed” inside
node_modules. - An independent gate. Deterministic checks run first and reject for free: the patch changed nothing, deleted the function instead of fixing it, broke the syntax, edited a file outside the located set, hardcoded a credential, or silenced the scanner (
verify=False,# nosec, a bareexcept:) instead of fixing the code. Whatever survives is reviewed by a separate model call, prompted to find the reason to reject rather than to approve.
4. Fix verification — re-running the original exploit
What: proof that a patch closed the hole, by replaying the finding’s own proof of concept against the patched build.
Why: every other platform validates a security fix by re-analysing it — re-running a scanner over the patch, or asking a second model whether it looks right. Both remain a guess about the code. We keep a working, re-runnable exploit for every finding, so we can settle it directly: the attack that worked no longer works. A scanner has nothing to re-run, which is why this is not a feature anyone can copy quickly.
How: deploy the fix branch to a preview environment, then call POST /api/runs/{run_id}/verify-fix with the finding and that URL. We replay the payload, judge each attempt against the canary the exploit plants, and return one of four verdicts.
| Verdict | Means |
|---|---|
| VERIFIED_FIXED | The exploit reproduced before the patch and no longer reproduces after it. The only verdict we will call a fix. |
| STILL_EXPLOITABLE | The attack still succeeds against the patched build. Even one success in ten counts — a flaky exploit is still an exploit. |
| INCONCLUSIVE | We cannot claim either way. Most often: no baseline, so there is nothing shown to have been fixed. |
| NOT_ATTEMPTED | No replay was run. A coverage gap, deliberately kept distinct from a refusal to claim. |
VERIFIED_FIXED is unreachable unless we measured the exploit succeeding before the patch. Without that, a clean run afterwards proves only that we failed to exploit it that day — exactly the inference we refuse to sell. The before-rate is read from our own prior measurement and never accepted from the caller, because a client that could post its own baseline could manufacture a pass. Silence over fewer than five attempts is also not evidence: targets are non-deterministic.Guide: scan on every pull request
On the Starter plan and up, a scoped scan runs on each pull request that touches your AI surface and blocks the merge on a proven, net-new vulnerability. Recurring findings are de-duplicated, so the pipeline stays quiet until something real appears. On the Starter plan and above, a confirmed finding can also open a draft fix pull request (and a dependency-update PR) your engineers review — nothing merges on its own. Review status is available at GET /api/pr-reviews.
Guide: scan with the GitHub Action
Wire scanning into any pipeline with our published GitHub Action. It scans on push and gates the build — or just notifies.
- Get a trigger key. In the Continuous view, open your asset and click CI to reveal its per-asset trigger key and asset id. The key is scoped to that one asset — it can start and agentless that asset's scans, never your whole account.
- Store it as a repo secret named
MILLENNIUMS_SCAN_KEY. - Add the workflow at
.github/workflows/security.yml:
name: security
on: [push]
jobs:
  scan:
    runs-on: ubuntu-latest
    steps:
      - uses: bl014h/millenniums-scan-action@v1
        with:
          api-key: ${{ secrets.MILLENNIUMS_SCAN_KEY }}
          asset-id: "abcd1234"
          fail-on: high   # critical | high | medium | low | never
fail-on: never is notify-only — it runs the scan and posts a job summary, but never fails the build. Rotate a key any time from the same panel; the old one stops working immediately.
Guide: ask questions about a scan
Not sure what a finding means, or how to fix it in your stack? Ask. POST /api/chat takes a list of messages and, optionally, a run_id so the answer is grounded in that specific scan's findings. Use it to turn a report into a fix plan.
Plans, quota & overage
Plans are quoted to fit your estate and usage — request a quote on the pricing page. Your plan's quota and limits are shown in the app under Billing.
- What's a scan? One run against one target. A pull-request check and a full scan each count as one.
- Overage. On paid plans, scans beyond your monthly quota bill at your plan's per-scan rate rather than blocking you.
- Free tier. A one-time allowance (never resets) so you can see a real finding before you decide. The working exploit and autofix unlock on any paid plan.
Existing customers can change plan from the app, or with POST /api/billing/checkout. For a new plan, talk to us.
Development phases
Where the platform is, and where it goes next. Everything under Shipped is deployed and working today — if it isn't, it's listed under Next or Exploring, not quietly implied.
Shipped
| Capability | What it covers |
|---|---|
| AI application pentest | The core engine: autonomous testing with a working proof of concept per finding, OWASP LLM Top 10 → MITRE ATLAS, black-box and white-box, incremental re-scan. |
| Cloud posture — AWS, Azure, GCP | Automated agentless connect for all three, verified before storing. 14 curated CVSS-scored checks, plus Prowler and Kubernetes ingest. |
| Redthread risk graph | One normalized graph across clouds; eight attack-path rules; ranked by severity, then proven, then directness. The AI rules (including T7 — an internet-reachable AI asset backed by sensitive data) need the config that names a model's bucket, so the AWS collector reads Bedrock knowledge-base data sources and SageMaker model containers; a stores edge is drawn only where that config explicitly names the bucket, never guessed from a name. ReadOnlyAccess already covers those calls, so no change to an existing scan role. |
| Cross-cloud risk | Federated trust between AWS, Entra ID and GCP — visible from a single connected cloud. |
| DSPM | Bounded content sampling through the agentless role; snapshot worker in your account for unmanaged databases; schema-fingerprint shadow-data detection. |
| Code-to-cloud | Terraform / CloudFormation / ARM / Kubernetes and secret scanning on every pull request, judged against your live graph. GitHub Actions and Azure DevOps. |
| Graph query | Saved questions plus a builder; results are paths with evidence, and the graph exports in an open format. |
| Remediation & ticketing | Signed, replay-bounded webhooks to automation you own; Jira and ServiceNow with the attack path in the ticket. |
| Threat-feed ingest | GuardDuty, Security Hub, Inspector, Defender for Cloud, Security Command Center and Prowler onto the same graph — no agent. |
| Network testing | Confirm-only external assessment against an authorized, ownership-proven scope. |
| Compliance | SOC 2, ISO 27001, ISO 42001, PCI DSS, HIPAA, NIST AI RMF / CSF 2.0, EU AI Act, and GDPR Art. 25 / 32. Machine-readable twin for Vanta / Drata / Secureframe. |
| Runtime sensor Enterprise add-on | Optional eBPF detections onto the risk graph. Off by default; detection, not prevention. |
| Platform | SSO, SCIM, RBAC, audit log, continuous scheduling with drift, CI keys, trend reporting. |
Next
Committed direction, in order. Enterprise customers influence the sequencing — if one of these is on your critical path, say so and it moves.
| Capability | What it adds |
|---|---|
| Admission control | Refuse a Kubernetes workload when admitting it would complete an attack path — this pod's service account is three hops from your customer data, and it's internet-exposed. A policy engine that only reads the manifest cannot express that. Runs in your cluster with a cached policy bundle, so your scheduling never depends on our uptime. |
| Cloud guardrails | Service control policies, Azure Policy and GCP Org Policy that make a misconfiguration impossible to create — recommended from the findings you actually have, applied by you, enforced by your provider. No agent anywhere. |
| Deeper cloud coverage | More services per provider, and cross-account / multi-subscription estates in one graph. |
Exploring
Under consideration, not committed. Listed because customers ask.
| Capability | Where it stands |
|---|---|
| Runtime response | Isolating or stopping a workload on a confirmed detection. Deliberately unhurried: an enforcement mistake is an outage, so this needs an audit-first rollout, a tested kill switch, and a support model to match — not a feature flag. |
| Inline enforcement | Blocking at the kernel via eBPF LSM. Highest blast radius of anything here; it ships only for a customer who has decided that trade is worth it, and it will be priced accordingly. |
| Author-your-own rules | A rule language so you can write graph rules yourself. The saved questions and the query builder cover most of what people actually ask for — we'll build the language when that stops being true. |
API — Authentication
Every request except signup and the Stripe webhook is authenticated with a bearer token. Your token is created at signup and shown in the app.
Authorization: Bearer YOUR_ACCESS_TOKENA missing or unknown token returns 401 Unauthorized. Keep your token secret — it grants full access to your account's scans and findings. If it leaks, rotate it (below) or from Settings in the app.
Passwordless sign-in. Emails a single-use, 15-minute magic link to the address on file. Always returns 200 whether or not an account exists (no account enumeration); rate-limited per network.
| Body | Type | Notes |
|---|---|---|
email | string | Required. The account email. |
Exchange a magic-link token for a fresh access token bound to your account. The token is single-use and expires after 15 minutes. Returns 400 if invalid or expired.
| Body | Type | Notes |
|---|---|---|
token | string | Required. The token from the #login= fragment of the emailed link. |
{ "token": "NEW_ACCESS_TOKEN", "tenant": "acme-1a2b3c", "plan": "free", "verified": true }Issue a new access token and revoke every previous one — use this if a key leaks. Authenticated with your current token; other signed-in sessions are logged out. Returns { "token": "…" }.
API — Base URL & conventions
- Base URL:
https://scan.millenniums.ai - Content type: requests and responses are JSON. Send
Content-Type: application/jsonon POSTs. - Success:
200 OKwith a JSON body. - Errors: a non-2xx status with
{ "error": "message" }. See status codes.
API — Account
Your account, plan, and quota. The quickest way to confirm a token works.
| Field | Type | Meaning |
|---|---|---|
tenant | string | Your account ID. |
plan | string | Internal key: free · starter · developer · enterprise. |
plan_display | string | The marketed name — developer shows as Growth. |
poc | bool | Whether working PoCs are unlocked on your plan. |
scans_used / scans_limit | int | Usage against your monthly scan allowance. |
apps_used / apps_limit | int | Registered targets against your plan's app cap (null = unlimited). |
verified | bool | Email verified — required to scan. |
The 2026-09-17 pricing model's meter: protected workloads and registered agent identities against your plan's included envelope, and what's currently over it. workload_cap/identity_included are null for an unlimited tier (Free's read-only graph, Enterprise). overage is the count of units past the envelope for each of workload/identity — null means unlimited, 0 means within envelope, a positive number bills automatically at your plan's overage_rate (per month) once metering_live is true. A paying tenant is never hard-blocked for growing past its envelope — only a free tenant with no card on file hits a real cap, at Agent Trust Fabric registration.
Owner only. The one-click AWS path: after creating the MillenniumsCloudScan stack from quick_create_url (returned by GET /api/cloud/onboarding), send {"account_id": "123456789012", "region": "us-east-1"}. Spaces and dashes in the number are ignored; region is optional. We derive arn:aws:iam::<account>:role/millenniums-cloud-scan, assume it with your external ID and confirm the account with STS before anything is stored. 400 with retry: true means the role isn't assumable yet — usually a stack that's still creating.
Owner only. Mints a private setup link for whoever manages your AWS: {"url": "…/connect/<token>", "expires_at": 1790298514}. The link is signed, bound to your workspace, valid for 7 days, and issuing a new one revokes the last. Its page reads GET /api/public/cloud-handoff/<token> (company name, the one-click link, whether AWS is connected — nothing else) and connects with POST /api/public/cloud-handoff/<token> {"account_id"}, which runs the same verification as above. Both public calls are rate-limited; an expired or replaced link returns 404.
What the Estate Scan screen draws from: one call per screen instead of six. For each surface — web, code, cloud, endpoint, ai — it returns whether it is connected, how much it found (with its unit), a human detail line, what it still needs, and the effort to connect it. Every count is read back from the store that owns that surface, so a surface is never reported connected on the strength of a form having been filled in once. scannable excludes the optional endpoint surface; connected counts only non-optional surfaces. workloads/agent_identities come from the same meter as /api/estate so the two screens can never disagree. There is no saas surface: third-party services are found indirectly today, through the keys and SDKs met in your code and cloud.
{ "connected": 2, "scannable": 4, "workloads": 31, "ai_services": 6,
  "surfaces": [ { "id": "cloud", "connected": true, "found": 1, "unit": "accounts",
                  "detail": "aws · 7 posture findings", "effort": "~2 min", "optional": false } ],
"agent_identities": 2 }Public. Create an account and get a token. A verification email is sent automatically.
| Body | Type | Required | Notes |
|---|---|---|---|
email | string | yes | Work email preferred. Disposable domains are rejected. |
company | string | no | Used to name your account. |
curl -X POST https://scan.millenniums.ai/api/signup \
  -H "Content-Type: application/json" \
  -d '{"email":"you@yourcompany.com","company":"Acme"}'
{ "token": "…", "tenant": "acme-3f9a2c", "plan": "free", "verified": false }Re-send the verification email to your account's address. Requires your token.
API — Scans
Turn one public link into scannable targets. Give the url of your site or app; we fetch the page, detect the AI surface (chat widgets, API/AI endpoints, LLM providers) and stack, and enumerate sibling environments from public certificate-transparency logs. Agentless — it doesn't attack anything.
| Body | Type | Notes |
|---|---|---|
url | string | Required. A public https:// website or app link. |
{ "root_domain": "acme.com",
  "ai_surface": [ {"type":"chat-widget","name":"Intercom"}, {"type":"api-endpoint","path":"/api/chat"} ],
  "environments": [ "staging.acme.com", "api.acme.com" ],
  "recommended_targets": [ "https://acme.com/api/chat", "https://staging.acme.com" ] }
Pick one of recommended_targets and pass it as the target to /api/scan.
Upload your application's source as a .zip for a white-box scan — no git required. The body is the raw zip bytes (Content-Type: application/zip). Returns an upload_id you pass to /api/scan. The upload is stored only for your account, used for that one scan, and deleted when it finishes. Max 100 MB.
curl -X POST https://scan.millenniums.ai/api/upload \
  -H "Authorization: Bearer YOUR_ACCESS_TOKEN" \
  -H "Content-Type: application/zip" \
  --data-binary @my-app.zip
{ "upload_id": "7Qb2x9Za" }.zip into the scan box — or send it to whoever manages your code and have them do it.Start a scan against a target. Gated on email verification, your remaining quota, and your plan's concurrency limit.
| Body | Type | Default | Notes |
|---|---|---|---|
target | string | — | Required. A URL, repository, or API endpoint to attack. |
upload_id | string | none | Optional. The id from POST /api/upload — a white-box scan of your uploaded code. Deleted after the scan. |
source | string | none | Optional. A git URL (https:// or git@) to clone for white-box. Use this or upload_id. |
budget | number | 10 | Per-scan spend cap, US dollars. |
mode | string | standard | Scan profile: quick, standard, or deep. |
curl -X POST https://scan.millenniums.ai/api/scan \
  -H "Authorization: Bearer YOUR_ACCESS_TOKEN" \
  -H "Content-Type: application/json" \
  -d '{"target":"https://staging.yourapp.com/chat",
       "source":"https://github.com/acme/chat-app","budget":15}'
{ "run_id": "20260731-abc123" }run_id immediately; poll GET /api/runs/<id> for progress and results.run_id. When you scan a linked GitHub repo whose commit is unchanged since a completed scan, no scan is started and no quota is spent — you get the baseline result instead. Check for no_changes before reading run_id, or your integration will break on the cheap path.
{ "no_changes": true, "baseline_run": "20260731-abc123",
"findings_count": 3 }force_full: true to scan anyway. A baseline from a scan that never finished is not trusted — you get a real scan instead.Incremental re-scans
Re-scanning a repo that hasn't changed is pure cost with no information. When a scan targets a linked GitHub repo, the commit it ran against is recorded as a baseline, and the next scan of that repo takes one of three paths:
| Situation | What happens |
|---|---|
| Same commit, previous scan completed | No scan, no charge. You get no_changes plus the baseline run and its finding count. |
| Commit changed | Only the changed files are mounted, so the expensive reconnaissance pass stays cheap. |
| Previous scan never finished (stopped, or hit its spend cap) | A full scan runs. An incomplete scan is never trusted as a baseline. |
Controlling a run
Stop a running scan. Returns 409 if it isn't running. You keep whatever it proved before you stopped it.
Finish an interrupted scan from its saved state instead of re-running it — for a scan that hit its spend cap, stalled, or was stopped. Returns 409 if it's already running.
The engine's own written pentest report (markdown). 404 when the scan didn't complete far enough to produce one. For the audit-facing document use the compliance report.
What the scan actually did — stages reached, agents run, token usage. Use it to see where a scan spent its budget.
Re-run a finding’s proof of concept against a patched build and record the verdict. Body: finding_key, url (the patched target), optional marker, method, headers, body, n (default 10, max 50). Returns verdict, reason, summary, and both measurements.
Returns 409 when no baseline exists for that finding — measure the exploit against the unpatched target first, or the result proves nothing. The target must be a public URL on a domain you have verified.
Generate a draft pull request fixing this scan's findings in your own code. Needs a connected GitHub repo. GET the same path for job status. Draft, always — nothing auto-merges.
Generate a draft PR bumping vulnerable dependencies (critical/high CVEs) to patched versions. GET for job status.
Check whether your code actually calls the vulnerable path of each exploitable dependency CVE; unreachable ones are suppressed. GET for job status. Runs automatically on completed scans with exploitable CVEs and a linked repo.
An OpenVEX document of this run's affected / not-affected determinations. POST the same path to set or clear a finding's determination: { "key", "status": "affected" | "not_affected" | "reset", "justification"?, "note"?, "owner"?, "expires_at"? }. A not_affected ruling is an exception and must be accountable: owner defaults to the workspace owner's email, expires_at (ISO date) defaults to 90 days out and may be at most 365 days out — a past date or a longer one is rejected with 400. The response echoes the owner and expires_at recorded. The ruling carries across future scans until it expires; after that the finding is served without the ruling and with vex_expired: true, vex_expired_at and vex_owner, so it resurfaces for re-review. Active rulings expose vex_owner and vex_expires on the finding.
Share a scan's summary to Slack (channel: "slack") or by email.
Buy the certified human review add-on for this scan — a CREST/OSCP reviewer validates every finding and the report is signed with their name. Returns a checkout URL; idempotent if already purchased, and 400 if your plan already includes review.
List your scans, most recent first — each with id, status, running, and findings_count.
One scan in full, including the findings array (see Findings for every field). On free-tier plans the poc field is withheld. Returns 404 if the run isn't yours.
The scan's chain-of-custody report — see Traceability. A timestamped timeline plus attestations proving your code stayed in an isolated sandbox, the sandbox was torn down, and (for uploads) the source was deleted. Every field is derived from a recorded event, not asserted.
{ "run_id": "20260731-abc123",
  "timeline": [
    { "ts": "2026-07-31T05:00:00Z", "event": "Isolated sandbox launched", … },
    { "ts": "2026-07-31T05:04:03Z", "event": "Sandbox torn down", "detail": "verified" },
    { "ts": "2026-07-31T05:04:04Z", "event": "Uploaded source deleted", … } ],
  "attestations": { "isolated_sandbox": true, "sandbox_torn_down": true,
"uploaded_source_deleted": true, "no_model_training": true } }| Field | Type | Meaning |
|---|---|---|
id | string | The run ID. |
status | string | running, completed, stopped: token cap, … |
running | bool | true until the scan finishes. |
findings_count | int | How many proven findings. |
findings | array | The findings (full detail on ?full / single-run fetch). |
API — Targets
Saved, named targets you scan repeatedly. These are what the CI plans scan on each pull request.
List your registered targets.
| Body | Type | Default | Notes |
|---|---|---|---|
target | string | — | Required. The URL / repo / API. |
name | string | = target | A friendly label. |
source | string | none | Source for white-box scans. |
instruction | string | none | Plain-English focus for the scan — areas to prioritise, test credentials, or specific endpoints to probe first. |
scope_mode | string | full | One of full, diff, auto. diff scans only files changed since diff_base and requires a git repo (a source, or a repository target) — otherwise returns 400. |
diff_base | string | default branch | With scope_mode: diff, the branch, tag, or commit to compare against. |
API — Domain verification
Prove you own a domain before scanning it — see Authorization & verification. Scanning a public target you haven't verified returns 403 with the token and instructions.
Returns your per-domain token and re-checks ownership (meta tag, then DNS TXT). Pass attest: true to record the authorization certification. Call it once to get the token, add the tag/record, then call it again to confirm.
| Body | Type | Notes |
|---|---|---|
domain | string | Required. The domain (or a URL — we use its root). |
attest | bool | Certify you own it / are authorized to test it. |
{ "domain": "acme.com", "verified": true, "method": "meta",
  "meta_tag": "<meta name=\"millenniums-verification\" content=\"…\">",
"dns_txt": "millenniums-verification=…" }List your domains and their verification status.
API — Schedules & assets
Register assets and put them on a cadence. Scheduling requires a paid plan. See Continuous scanning.
List your registered assets. POST /api/targets registers one ({ "target", "name" }); DELETE /api/targets/{id} removes it.
Create or update a schedule.
| Body | Type | Notes |
|---|---|---|
asset_id | string | Required. A registered asset. |
cadence | string | daily · weekly · monthly. |
trigger_on_change | bool | Enable drift-triggered re-scans between runs. |
GET /api/schedules lists them; DELETE /api/schedules/{id} removes one.
Per-asset rollup: latest status, severity counts, opened/resolved delta, and schedule. /api/overview.csv returns the same as CSV. GET /api/assets/{id}/trend returns findings-over-time for one asset.
Findings-over-time for one asset — its scans oldest to newest, each with the open count plus what opened and what resolved since the previous scan. This is the series behind the risk-trend chart.
{ "asset": { "id": "a1b2c3", "name": "Support chat", … },
  "series": [ { "at": "2026-07-24T…", "run_id": "…",
"open": 5, "opened": 2, "resolved": 1 }, … ] }Scan a registered target now, using its saved settings — source, scope, instruction, learned knowledge, and its prior findings for regression awareness. Returns {"run_id": …}, subject to your plan's quota and concurrency limits.
Remove a registered target. Past scans and their reports are unaffected. DELETE /api/schedules/{schedule_id} removes a schedule the same way.
Revoke the asset's current CI scan key and issue a new one. The old key stops working immediately.
API — CI trigger keys
A per-asset key lets CI or a webhook start and read scans of one asset without your account token. See the GitHub Action guide.
Reveal (or mint) the asset's trigger key and its trigger/status URLs. POST /api/assets/{id}/key/rotate revokes the old key and mints a new one.
Header X-Scan-Key: {key} (not a bearer token). Starts a scan of the asset; returns { "run_id" }. A quota/concurrency block returns a non-2xx so CI sees it.
Header X-Scan-Key. Poll status: { status, done, findings_count, severity, max_severity }. A key can only read its own asset's runs.
API — Assess & modules
The current-state model and the module marketplace. See Assess & Consolidate. All routes require your bearer token; the stack editor is owner-only.
The whole current-state report over your graph: summary (assets, controls, covered/partial/uncovered, ai_gaps, replaceable), posture per domain, coverage per asset, ai_gaps (the uncovered AI/agent surfaces), replace_map (each control → the modules that replace it, with roadmap and note), modules (the entitlement state folded in), and quantify (consolidation ROI, risk, effort — every figure input-driven or null, see Quantification). Your declared stack is overlaid at read time.
The marketplace: plan, the full modules registry (id, name, category, mode, min_plan, availability, scan_type, addon, depends_on, plus included_from on modules a plan tier includes by default), and state — {id: {enabled, reason}}, where reason explains why an off module is off. Team & Roles (team) is one such module: included with Enterprise, and on any other plan we can add it to your workspace — it then shows as on here and unlocks /api/members.
Your declared security stack (stack: [{name, category, cost?}]), your economic assumptions (econ: {breach_cost, hours_per_fix, hourly_rate}), and the valid categories. POST the same route (owner only) with { "stack": [{ "name", "category", "cost"? }], "econ"?: {…} } to replace them — the list is normalized and de-duplicated, then mapped onto the graph as coverage (and priced into the consolidation ROI) on the next /api/assess read. Categories: edr, cspm, cnapp, dspm, vuln, waf, dlp, iam, ai_security, siem, pentest. Costs and econ inputs are optional; absent inputs yield null figures, never guessed ones.
Owner only. Mints (or returns) the detect-only endpoint agent's key and the ingest_url. Install the agent with this key; see Endpoint.
Called by the headless agent, authenticated with its enrollment key (Authorization: Bearer <key>) — not a user token. Body: { "hosts": [{ "host_id", "hostname"?, "os"?, "exposure"?, "posture"?, "agents"? }] }. Each report replaces the fleet snapshot on the graph (detect-only; the agent never receives a command back). GET /api/endpoint returns the current fleet and enrollment state.
Endpoint Prevention — a connected partner's engine. Owner-only, Enterprise + the add-on: POST /api/endpoint/prevention/connect with { "vendor", "webhook_url" } (https only) returns a per-workspace key and webhook secret, shown once. GET /api/endpoint/prevention returns connection status — vendor, last check-in, hosts by mode, never the key or secret.
Partner-key auth (Authorization: Bearer <key>), not a user token. Body: { "vendor", "hosts": [{ "host_id"?, "hostname"?, "mode": "block"|"detect"|"off", "engine_version"?, "policy_version"? }] }. Matched by host_id first, hostname as fallback; an unmatched host is reported back, never dropped. mode rides the graph edge exactly as reported — a detect-mode host is never counted as prevented, only as watched.
Owner-only. Asks the connected partner to act: { "host_id", "action": "isolate"|"kill_process"|"quarantine_file", "target"?, "reason"? }. Sends a signed request (X-Redthread-Signature: sha256=<hmac> over "<timestamp>.<body>", the same construction ToolHive signs its own webhooks with) to the partner's webhook_url. The partner's engine remains the authority — a refusal is recorded, never overridden or retried automatically.
Partner-key auth. The partner's async outcome for a prior enforcement request: { "request_id", "outcome", "detail"? }. 404 if the request_id is unknown for that workspace.
The AI rollout-safety gate's live policy: the canary rings (percent), the crash/error thresholds, and that it is active. See AI Rollout Safety.
API — Agent Trust Fabric
Activate the layer, register subscribers, and read the signed trust-state stream. See Agent Trust Fabric. All routes use your bearer token except the public-key endpoint (intentionally unauthenticated, rate-limited, for offline verification).
Owner only. Turns the layer on and mints the workspace's Ed25519 signing key (kept in the secrets vault; the private key is never returned). Emits a baseline event per node. POST /api/trust-signal/deactivate stops new emission but keeps keys and history (non-destructive).
Whether the layer is active, the registered webhooks (secrets masked), per-state node counts, and the public-key URL.
Owner only. Register a subscriber: { "url", "secret"? }. Deliveries carry the Ed25519-signed event as the body and, when a secret is set, an X-Redthread-Signature: sha256=… HMAC header. POST /api/trust-signal/webhooks/{id}/test sends a signed test event; delete with { "_method": "delete" } on the id path.
No auth. Returns the workspace's Ed25519 public key so any third party can verify a signed event offline. A well-behaved subscriber must check both the signature and the event's expires_at.
The recent signed-event feed. GET /api/trust-signal/history/{spiffe_id} returns the append-only ledger for one identity. POST /api/trust-signal/recompute recomputes trust from the current graph and emits any changes now.
Owner only. The per-tenant SPIRE deployment: your trust domain, the Terraform apply command (module at deploy/terraform/spire), the in-cluster sync key, and deployment status (SVID count). The in-cluster svid-sync posts issued SVIDs to POST /api/trust-signal/svids (authenticated with that sync key), which writes the real SVID identities onto the graph.
Agent Trust Fabric — self-serve agents, actions and the public badge. Sign up with {"product":"atf"} on POST /api/signup and the layer is active from the first request.
Register an agent: { "name", "scopes": ["read:ledger", …] | "*", "framework"? }. Creates an agent node, issues its spiffe_id and returns a per-agent key (shown once, stored hashed) plus badge_url, verify_url, embed_md and embed_html. GET /api/trust-signal/agents lists them with their current mark, level, action counts and badge URLs. POST /api/trust-signal/agents/{spiffe_id}/restore (owner) lifts a revocation after review; counts stay.
Agent-key auth (Authorization: Bearer atfk_…), no workspace token. Body { "spiffe_id", "tool", "scope", "caller"?, "delegation"? } — caller is the principal that asked (200 chars) and delegation the chain it came through (up to 10 entries); both are recorded inside the signature, so a receipt answers who made the agent act, not just that it acted. In scope → a signed action event appended to the ledger. Out of scope → the same signed record, the identity is revoked with a signed policy_violation trust-state event, webhooks fire. Response { ok, in_scope, state, event }; 401 on an unknown identity or bad key.
ATF Enforce — preview. The API surface below exists and runs; every new grant starts in shadow mode (decide and record, never block) and enforcement is an explicit per-identity opt-in. Nothing here is a claim that ATF stops an incident: that claim is gated on the acceptance conditions in the Enforce TRD, and a badge only reads enforced: true while the identity is in enforce mode and the gateway has decided real traffic for it in the last five minutes — a ToolHive-only deployment never does, and neither does a gateway that is running while the agent's tools go around it (proxy environment variables are advisory: an agent runtime that carries its own intercepting proxy has to be chained to the gateway as that proxy's upstream, and the network has to be default-deny). WebSocket and SSE frames are not inspected; the gateway decides on the upgrade request. Registration accepts "rules": [{ "id"?, "host", "methods"?: ["GET","HEAD"], "paths"?: ["/stats/*"], "max_body_bytes"?: 0, "passthrough"?: true }] (passthrough is for a certificate-pinned destination: the gateway tunnels it without interception, decides on the host alone, and records inspected: false); tool-name scopes keep working but only ever narrow a matching rule, never grant on their own — an agent registered with scopes alone has a deny-all grant in shadow. The gateway is integrations/atf-gateway-envoy/ (Envoy, with the OWASP Core Rule Set run by Coraza); it has passed a bench gate and has not yet run in enforce mode on a customer workload, so this remains a preview. A gateway's attack rules are written for traffic arriving at a web application, and an ordinary HTTP client can trip them: expect that in shadow, and rule on it in the review queue. The earlier mitmproxy prototype is integrations/atf-gateway/.
Owner only. { "rules"?, "mode"?: "shadow" | "enforce", "window"?: { "seconds", "denials" } }. Sets the structured grant and/or flips shadow ↔ enforce; window tunes the circumvention detector. A rules or window change bumps policy_version (a polling gateway picks it up without a restart) and resets the burn-in. mode: "enforce" is refused — 400 with the exact reasons — until the identity's burn-in is ready: at least 100 shadow decisions over at least an hour under the current grant, and every would-have-blocked decision reviewed and agreed. It cannot ride along with a rules or window change in the same call. Bad rules are rejected, never parsed leniently.
The burn-in state: { ready, blocking: [reasons], decisions, seconds, blocked_total, unreviewed, disagreed, policy_version, groups: [ { host, method, reason, count, unreviewed, agree, disagree, inspected, example_event_id, sample_resources } ], blocked: [ { event_id, resource_key, method, reason, action, inspected, at, verdict } ] }. blocked is every request the gateway would have blocked while in shadow; groups is the same queue grouped by host, method and reason, biggest unreviewed first — on a real browsing-agent scan 157 blocked requests were twelve hosts, and one host was 74% of them. inspected: false means the gateway saw only the hostname (an HTTPS tunnel it did not intercept).
Owner only. { "event_id" | "host", "method"?, "verdict": "agree" | "disagree" }. Rule on one decision (event_id) or on a whole group (host, case-insensitive, optionally narrowed by method). agree: that request should be blocked. disagree: it was legitimate — the grant is wrong, and enforce stays refused until the grant changes (which restarts the burn-in). Returns the updated burn-in state plus applied, the number of decisions the verdict landed on.
Agent-key auth. What a gateway pulls: { grant, paused, policy_version, rules_version, issued_at, ttl, issuer, signature }, Ed25519-signed with the workspace key so the gateway verifies it offline against /keys/public/{tenant} and decides locally with no round trip on the request path. A gateway past ttl without a fresh pull fails closed. Pulling counts as a gateway heartbeat.
Agent-key auth. A gateway reports a decision it already made: { "spiffe_id", "decision": { "action": "allow" | "deny" | "deny_and_pause", "reason", "rule_id", "resource_key", "shadow", "inspected" }, "request"?: { "host", "port", "tool", "method" } }. Signed into the ledger as an allow, deny or deny_and_paused event carrying enforced. A non-shadow deny_and_pause revokes the identity exactly as an out-of-scope self-report does (same trust-state event, same webhooks, same /restore); a shadow one is recorded and changes nothing.
Agent-key auth. { "spiffe_id", "public_key" } — the public half of the keypair the gateway signs request receipts with (a real base64 32-byte Ed25519 key, or 400). The private half is generated on the gateway host and never sent to us. Published as gateway_public_key on the verify document; rotating it invalidates earlier receipts by design.
No auth, rate-limited. For the site being hit, which has no relationship with whoever runs the agent. Body { "receipt" } (the inbound X-ATF-Receipt header value) or { "headers": { … } }. Answers { covered: true, action, enforced, inspected, resource_key, issued_at, expires_at, identity_state, identity_enforced_now, spiffe_id, tenant, public_key_url }, or { covered: false, reason } with reason one of no-receipt, malformed, unknown-identity, no-gateway-key, bad_signature, expired. covered: false means only that no valid receipt was presented. It is true of every ordinary human request, so scope the question to traffic your own WAF or bot detection already suspects is an agent; we do not identify agent traffic for you.
No auth, rate-limited. The data behind a badge and nothing more: state, mark (unknown / verified / attested / degraded / revoked), level (0–3), as_of, valid_until, attested, enforced (true only in enforce mode with gateway traffic for that identity in the last five minutes — a policy pull is not evidence), action counts. An unregistered identity or an inactive layer returns unknown, level 0 — never an error, never green. identity may be the agent slug, agent/<slug>, or the full spiffe id.
No auth, rate-limited. The offline-verifiable document: the badge data plus the last ledger events for that identity, Ed25519-signed with the workspace key over its canonical JSON (sorted keys, no spaces, signature removed). Verify against /api/trust-signal/keys/public/{tenant}. The public badge and verify pages are served on the product domain at https://trust.millenniums.ai/badge/…svg and /v/… (an edge Worker in front of these endpoints, 60-second cache).
Level-1 publisher badges — the registry scan. Every server in the official MCP registry is scored daily from its published manifest, whether the publisher asked or not, and the result is served at https://trust.millenniums.ai/badge/mcp/{namespace}/{server}.svg with the check-by-check detail at /v/mcp/{namespace}/{server}. Checks are static-secrets, secret-no-default, transport-tls, version-pinned, source-published, artifact-hash (MCPB bundles only — npm and PyPI carry their own registry integrity, so the check does not apply to them), oci-digest (container images pinned to an immutable @sha256: digest rather than a tag that can be repointed after you approve the listing) and (from the second scan on) unchanged-since-last-scan; a check that cannot apply to a server is dropped from its total rather than failed. The rule set is versioned (currently atf-3) and each published score carries it. Nothing is fetched or executed, so the claim is static — passed N of M published checks on a date, never a runtime claim. A score expires after 7 days and the badge then renders grey. Gateway integration. An MCP gateway already brokers every tool call, so it is the natural place to report them. integrations/toolhive/atf_receipts.py is a dependency-free sidecar for ToolHive: it either tails ToolHive's audit log or runs as a ToolHive validating webhook (verifying ToolHive's own X-ToolHive-Signature, and always answering allow — it witnesses, it does not gate), turning each tool call into a signed action with its caller and delegation chain. Discovery calls (tools/list, initialize) are dropped: permission to discover a tool is not evidence it ran. No ToolHive patch is required.
The scanner is scanner/mcp_scan.py and the aggregate is published at trust.millenniums.ai/mcp-scan. Levels 2 (verified) and 3 (attested) are earned by the consuming workspace running agents, not by a publisher.
API — Discovery & inventory
Find AI assets and manage the unified inventory. See Shadow-AI discovery.
Scan a connected GitHub org/account ({ "github_org" }, blank = everything you can access) for AI-powered repos. Returns candidates plus honest coverage (repos_scanned/total/skipped). POST /api/discover/repo checks a single repo.
The unified inventory: candidates across every surface that ran, plus a coverage banner. POST /api/shadow/confirm ({ "key" }) registers a candidate as an asset; POST /api/shadow/dismiss hides one.
Scan one connected repo (github_repo: "owner/name") for LLM SDK and API usage. Returns whether it's AI-powered, which providers, and the files that evidence it.
Confirm a candidate — it becomes a registered asset you can scan and schedule. POST /api/shadow/dismiss dismisses one (not AI, already known, out of scope); the ruling survives future discovery runs.
API — Infrastructure & Cloud
Map an agentless cloud inventory to misconfiguration findings. See Infrastructure & Cloud.
Everything needed to connect that provider: your unique external ID and ready-to-run Terraform (AWS), or the exact az / gcloud commands (Azure / GCP). Owner only.
Connect a provider. AWS: { "role_arn", "region" } — the external ID is server-side. Azure: { "tenant_id", "subscription_id", "client_id", "client_secret" }. GCP: { "project_id", "service_account_key" }. The credential is verified with a real read call before it is stored — a bad one returns 400 and is not saved. Secrets are write-only and never returned. DELETE the same path to disconnect.
Every connected provider, secrets masked (client_secret_set: true, never the value).
Collect agentless and run the checks for one provider. AWS enumerates S3, IAM (incl. full authorization details), EC2, RDS, CloudTrail, Lambda, EKS, ELBv2, DynamoDB and Secrets Manager; Azure via Resource Graph; GCP via Cloud Asset Inventory. Rebuilds the risk graph and fires any matching workflows. Agentless — no model cost.
The AWS-only legacy form, kept for compatibility. Also runs DSPM bounded sampling unless {"classify": false}.
Connection state + latest scan summary. GET /api/cloud/posture returns the latest findings.
For GCP/Azure/Kubernetes (or a paste path): { "inventory": {…} } with _provider set — the same checks run over your agentless inventory. (Admins can also use POST /api/admin/cspm.)
API — Risk graph
Ranked attack paths and the Redthread graph behind them. See Redthread — risk graph.
Ranked toxic combinations. Each risk carries rule (T1–T8), severity, proven, narrative (the readable path), nodes, path (edge-by-edge with evidence), mitre and blast. Ordered by severity, then proven before potential, then path length. Computed on read, so it can never be stale against the graph.
The whole graph in graphify node-link format — open, not proprietary. Traverse it yourself: graphify path "internet" "customer-data" --graph graph.json.
Shadow-data candidates: stores whose schema fingerprint matches a production store. A candidate is for review, not a proven data transfer, and the response says so.
The query vocabulary for building your own questions — node kinds, relations, operators, attributes, and the saved queries. Derived from the graph schema, so it cannot drift.
Ask the graph a plain-English question: { "question", "limit"? } (question up to 400 characters; limit defaults to 200, at most 500). A model turns the question into a structured query, and the graph's closed vocabulary decides whether it runs — a relation or node kind the model invented is rejected before a single edge is walked, returned as { "ok": false, "unsupported": "…" } with status 200. On success: { ok, question, query, understood, answer, results, matches, chokepoints, advice, nodes }, where query is exactly what ran and understood is it in words, so you can check the model's reading before trusting the answer. Requires a role that can run scans (403 for read-only). Rate-limited per tenant per hour by plan (10 Free, 40 Starter, 120 Growth, 400 Enterprise; 429 with limit and window_seconds), checked before the model call; 502 if the model is unavailable. The structured builder (POST /api/graph/query) is not limited.
Run a structured query: { "saved": "cross-cloud-key-to-pii" } or a query object —
{ "query": {
    "find": { "kind": "compute", "exposure": "internet" },
    "then": [ { "via": "contains-secret-for" },
              { "via": "has-permission-to", "max_depth": 3,
                "to": { "kind": "data", "classification": ["pii","pci"] } } ] } }
Returns matching paths with evidence per hop. A query is data, never code: unknown relations are rejected, hops and results are bounded.
API — Code-to-cloud gate
Check infrastructure templates before they ship. See Code-to-cloud.
{ "files": {"infra/s3.tf": "<contents>"}, "account_id": "…", "comment": {"repo": "owner/name", "pr": 42} }
Returns findings (the same checks, pre-deploy), secrets (location and kind only — never the value), introduced (risks this change would add to your live graph), and gate — one boolean plus every reason. Optional comment posts to the pull request as a single upserted comment.
Authenticate with your bearer token or a per-asset X-Scan-Key, so CI never needs your account token. Templates supported: Terraform (HCL and .tf.json), CloudFormation, ARM, Kubernetes.
API — Data security posture
See DSPM.
Classified data stores: category, counts observed in the sample, columns, and schema fingerprint. Never values.
Findings from the snapshot worker running in your own account, authenticated with X-Snapshot-Key. Accepts classification results only — the worker has no path that transmits file contents.
API — Remediation & ticketing
{ "name", "url", "kind": "webhook|jira|servicenow", "rules": ["T2"], "min_severity": "critical", "proven_only": false, "auth_header": "Basic …" }. The signing secret is returned once and never again. Destinations must be HTTPS and resolve to a public address.
Your workflows with delivery history. Secrets and auth headers are masked to a presence flag.
Fire a synthetic delivery to prove the wiring. DELETE /api/workflows/{id} removes it.
Verifying a delivery: the X-Millenniums-Signature header is t=<unix>,v1=<hmac-sha256> over <timestamp>.<body>. Reject anything older than five minutes. Reference implementation: onboarding/terraform/remediation/handler.py.
API — Runtime sensor
Enterprise add-on. See Runtime sensor.
Add-on state (enabled, eligible, granted, requires_plan), enrolled sensors with online status and event/drop counts, and recent detections.
{ "enabled": true } — the workspace owner turns the add-on on. Turning it off revokes every enrolled sensor.
Mint a sensor and its one-time key. DELETE /api/sensors/{id} revokes it immediately.
Used by the sensor itself with X-Sensor-Key. Bounded per post and per hour; over the limit events are dropped and counted.
API — Network testing
See Network penetration testing.
Scope, ownership verification, Rules of Engagement state, and the last run.
Define the CIDRs/hosts to test. Over-broad ranges are refused. Then /api/network/verify proves ownership and /api/network/authorize signs the RoE — both are hard gates before a scan can start.
Launch a confirm-only scan against the authorized scope. DELETE /api/network clears the scope.
Internal networks — connectors
Networks you cannot reach from the internet are tested through a thin, outbound-only connector you run inside them. Enrolling and listing connectors is owner-only; enrolling needs the Growth plan or above.
Body { "name" }. Returns { id, key, docker }: the connector id, its one-time key (shown once), and the docker run command that starts it. The connector only ever dials out to this API.
Your connectors and whether each is online.
Body { "connector_id" }. Queues the authorized scope to that connector and returns a run_token. Refused (400/403) until a scope is defined, the Rules of Engagement are signed, and the scope is inside a signed, in-window authorization. Needs a role that can start scans; 404 for an unknown connector.
Revoke a connector immediately (owner only).
Credentialed scanning
Supply a read-only account so the scan can check patch level and configuration from the inside. Secrets are kept server-side and are never returned by the API or written to the audit log.
Body { "type", "username", "secret", "label"? } with type one of ssh, smb, web, domain. Owner only; Growth plan and above. Returns { id }.
The masked credential list plus the accepted types (owner only). The secret is never in the response.
Remove a stored credential (owner only).
Tier 3 — exploitation (off by default)
Proving a finding by exploiting it is a separate, gated tier. It is disabled on the platform by default, and on this deployment the execution step is not provisioned: every gate below can pass and the run still returns 501. These routes exist so approval, attestation and audit trail are in place before anything is enabled. All are owner-only except run.
The exploit catalog (registry), whether exploitation is enabled on this deployment, your approvals, the readiness checklist, and the operator certification state.
Body { "key", "done", "note"? }. Attest one item of the enablement checklist — signed exploitation addendum, third-party authorization, legal review, insurance, verified safeguards, incident runbook, customer de-confliction. Audit-logged with who attested it; an unknown key is 400.
Body { "target", "exploit_id", "approved_by", "window_end"? }. A per-target human approval (name and title of the approver required; window defaults to 7 days). The target must already be inside a signed, in-window network authorization. Approval only authorizes — it does not run anything, and the response says so when exploitation is not enabled.
Body { "approval_id" }. Fail-closed: refused with 403 unless the readiness checklist is complete, an operator has issued a signed enablement certification for your workspace, exploitation is enabled, the approval is current and unused (one run per approval), the target is authorized, and the exploit is non-destructive. Even when every gate passes it returns 501 with gate: "passed" — nothing is executed here.
Revoke an approval.
API — Reports & attestation
Audit-support deliverables from a completed run. See Compliance report & attestation.
The full compliance report (HTML). /api/runs/{id}/compliance.json returns the JSON twin for Vanta/Drata/Secureframe.
The redacted, shareable Letter of Attestation — scope, dates, methodology, severity counts, no exploit detail. Add .json for the structured form.
{ "attestation_id": "MLN-LOA-20260731-abc123",
  "entity": { "legal_name": "Acme Ltd", … },
  "severity_summary": [ { "severity": "High", "identified": 2,
                          "remediated_or_accepted": 2, "open": 0 } ],
  "material_findings": { "state": "all_remediated", "text": "…" },
"signature": { "signatory": null, "human_review": false, … } }Declare your AI system description for the report's AI attack-surface section — model, model_version, fine_tuned, rag, tools, autonomy, trust_boundaries. Anything you don't declare is shown as not characterized; we never infer your architecture.
Replay a behavioral finding's PoC N times (≤50) against a verified-owned target to record its Attack Success Rate. Body: { finding_key, url, method, body, n, marker }. Marker/refusal judging — no model cost. In the report JSON, asr is null until a replay runs and cvss.score is null for behavioural findings — treat a missing value as "not measured", never as zero or a pass. POST /api/runs/{id}/human-review starts a certified-review Checkout.
API — SSO & SCIM
Enterprise identity. Owner + Enterprise plan. See SSO, SCIM & roles.
Configure OIDC ({ issuer, client_id, client_secret, domain }). GET /api/sso/status shows config; DELETE /api/sso disables it. Redirect URI: https://scan.millenniums.ai/api/sso/callback, scopes openid email.
Issue the SCIM token (or { "rotate": true }). GET /api/scim/status shows the Base URL + token. The IdP uses the SCIM 2.0 endpoints under /scim/v2/ (Users create/read/update/deactivate) with that token as an OAuth Bearer Token.
API — Team, audit & knowledge
The workspace roster with each member's role. Requires the Team & Roles module (team in /api/modules): included with Enterprise (the legacy Compliance tier also qualifies) and addable to any other plan by us. Every members route — list, invite, role change, remove — is gated the same way; without the module they return 403 with module: "team" and an upgrade hint. POST invites a teammate by email, POST /api/members/role changes a role, and DELETE /api/members/{email} removes them and revokes their tokens.
| Role | Can |
|---|---|
| Owner | Everything, including billing and the workspace token. |
| Admin | Scans, remediation, knowledge, integrations, members — not billing or the token. |
| Member | Scans, remediation, knowledge. |
| Viewer | Agentless. Sees everything, changes nothing. |
The workspace audit log — who started scans, accepted risk, changed schedules, rotated keys, or changed membership. Enterprise plan.
Per-workspace context the scanner carries into every scan of an asset — how to log in, which endpoints matter, what to leave alone. POST adds an entry; DELETE /api/knowledge/{id} removes one.
Connect a Slack incoming webhook for scan results. GET /api/slack/status reports whether one is set; DELETE disconnects it.
Whether GitHub is connected for this workspace — the prerequisite for white-box scans of private repos, draft fix PRs and repo-based AI discovery.
API — PR reviews
The status of pull-request scans for your registered targets (Starter plan and up). Each entry reports the PR, whether the scoped scan is clean, and any proven net-new findings that blocked the merge. See the CI guide.
API — Chat
Ask questions in natural language. Pass a run_id to ground the answer in a specific scan.
| Body | Type | Required | Notes |
|---|---|---|---|
messages | array | yes | Chat turns, e.g. [{"role":"user","content":"…"}]. |
run_id | string | no | Grounds the reply in that scan's findings. |
{ "reply": "The prompt-injection finding on /chat lets a user…" }API — Billing
Start a Stripe Checkout session to upgrade. Returns a hosted checkout url to redirect the user to.
| Body | Type | Notes |
|---|---|---|
plan | string | starter · developer · team. Enterprise is sales-led. |
{ "url": "https://checkout.stripe.com/c/pay/cs_live_…" }Returns 501 if billing isn't configured on the instance, 400 for an unknown plan.
API — Errors & status codes
Errors return a JSON body { "error": "…" } with one of these statuses:
| Code | Meaning | Common cause |
|---|---|---|
400 | Bad request | Missing target, invalid email, unknown plan. |
401 | Unauthorized | Missing or unknown bearer token. |
402 | Payment required | Scan quota reached — upgrade or add a card. Body includes plan, quota, used. |
403 | Forbidden | Email not verified, or account suspended. |
404 | Not found | Unknown route, or a run that isn't yours. |
429 | Too many requests | Signup rate limit, or your plan's concurrent-scan cap. |
500 | Server error | Scan couldn't start (Docker / model key), or chat failed. |
501 | Not implemented | Billing not configured on this instance. |